Expt (1): Preparation of 2-chloro-2methylpropane
(i) Objective
To perform a micro-scale preparation of 2-chloro-2-methylpropane (t-butyl chloride) and determine the percentage yield
(ii) Safety
All experiments should be carried out in well-ventilated laboratories. Students suffering from chronic respiratory symptoms may trigger asthma if inhaled generated gases. Wear safety spectacles and protective mask. Avoid parts of the body from contaminating chemicals. Information for handling chemicals can refer to Material Safety Data Sheet (MSDS). |
|
(iii) Reagents and equipment
| Reagent | Qty | Equipment | Qty |
| ** Conc. HCl | 5 cm3 | “Distillation Cup” | 1 |
| * 2-Methly-propan-2-ol | 5 cm3 | Test tube | 1 |
| Small test tube | 1 | ||
| Stand and clamp | 1 | ||
| 10 cm3 measuring cylinder | 1 | ||
| Micro-tip plastic pipette or 3 cm3 disposable syringe | 1 | ||
| Jumbo plastic pipette | 1 | ||
| Micro-spatula | 1 | ||
| Electronic balance (± 0.01g) | 1 | ||
| Fine anti-bumping granule | some | ||
| Pin-type thermometer | 1 | ||
* **
**
(iv) Experimental procedures
- Place 0.280 g of 2-methylpropan-2-ol (usually in liquid form, m.pt. = 26oC) into a test tube
- Using a Jumbo plastic pipette, add about 2 cm3 of conc. hydrochloric acid. Add also a small spatula measure of fine anti-bumping granules.
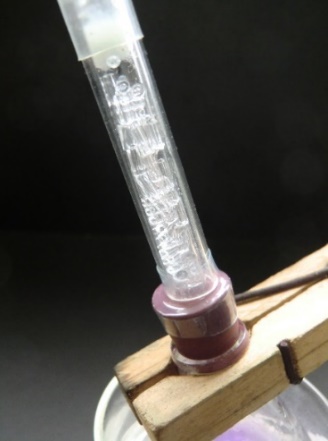
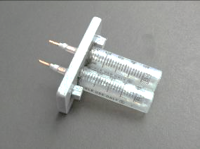
- Clamp the test tube and lower it into the mini-heater. Switch on the low voltage power supply. Clamp the prepared “Cold Stick” and lower it into the test tube until the end of the brass rod is about 1 cm above the surface of the solution mixture. Reflux for 5 minutes (Fig. 31, page 14).
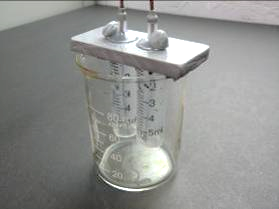
- Remove the “Cold Stick” and place the distillation cap with the cup onto the tip of the brass rod. Lower the arranged setup into the test tube again and start distillation (Fig. 185).
- Wait until the small brass cup has collected enough distillate. Remove the distillation setup from the test tube. Transfer the distillate to a weighted small test tube with the help of a micro-tip pipette.
- Repeat procedure (5) a number of times until all the upper layer of the reaction mixture has been collected.
- Determine the mass of the distillate.
- Using the pin-type digital thermometer and with the help of the “Cold Ring”, determine the b.p. of the distillate (Fig. 33, page 14).
(v) Results
![]()
Mass of distillate (2-chloro-2-methylpropane) = 0.143 g
No. of mole of 2-methylpropan-2-ol used = 0.28/74 = 0.00378
No. of mole of crude 2-chloro-2-methylpropane formed = 0.143/92.6 = 0.00154
% yield of 2-chloro-2-methylpropane = (0.00154/0.00378) x 100 = 40.7%
B.pt. of 2-chloro-2-methylpropane = 51.0oC (Literature value: 50.8oC)
(Fig. 185) Micro-scale distillation
(vi) Conclusion
Percentage yield of 2-chloro-2-methylpropane formed by the reaction of conc. HCl with 2-methylpropan-2-ol was determined to be 40.7%. Boiling point inspection indicated the product was reasonably pure.
(vii) Remarks
Video clip Preparation of 2-chloro-2-methylpropane shows 2-chloro-2-methylpropane is insoluble and less dense than aqueous solutions. Therefore, it floated atop of the reaction product mixture. One quick way of getting this layer is withdrawal by using a syringe instead of performing distillation.
Preparation of tert. butyl chloride
Expt (2): Preparation of ethylmethanoate
Choice of ester for preparation
Esters are formed by the reaction between alkanol and alkanoic acid with conc. sulphuric acid as catalyst. Esters of low molecular mass and their respective boiling points are listed in the following table (Fig. 186):
Preparation of esters of low RMM | ||
| Ethyl ethanoate | Equation: | C2H5OH + CH3COOH |
B. Pt.: | 78 oC 118 oC 77 oC 100 oC | |
Ethyl methanoate | Equation: | C2H5OH + HCOOH |
| B. Pt.: | 78 oC 101 oC 54 oC 100 oC | |
| Methyl methanoate | Equation: | CH3OH + HCOOH |
| B. Pt.: | 65 oC 101oC 32 oC 100 oC | |
| Methyl ethanoate | Equation: | CH3OH + CH3COOH |
| B. Pt.: | 65 oC 118 oC 57 oC 100 oC | |
(Fig. 186) Esters of low RMM, their preparations and boiling points
In the past, school chemistry practical usually chose the formation of ethyl ethanoate as student experiment for the topic on ester. However, inspection of the above table revealed that the b.pts of the product (ethyl ethanoate, 77oC) and the reactant (ethanol 78oC) are very close to each other. If the refluxed mixture is directly changed to the distillation mode, the two chemicals will appear in the distillate in appreciable proportion, leading to a very low yield of the desired ester
A better idea is to choose an ester with a b.pt. quite different from that of the reactants and the other product. Considering the b.pt. of ethyl methanoate being only 54oC, significantly different from that of ethanol (78oC), methanoic acid (101oC) and water (100oC), preparation of ethyl methanoate is obviously a good choice. Also, methyl methanoate with a b.pt. of 32oC is too volatile to be considered.
(i) Objective
To perform a micro-scale preparation of ethyl methanoate and determine its percentage purity
(ii) Safety
All experiments should be carried out in well-ventilated laboratories. Students suffering from chronic respiratory symptoms may trigger asthma if inhaled generated gases. Wear safety spectacles and protective mask. Avoid parts of the body from contaminating chemicals. Information for handling chemicals can refer to Material Safety Data Sheet (MSDS). |
|
(iii) Reagents and equipment
Reagent | Qty | Equipment | Qty |
* Methanoic acid (highly irriating) | 5 cm3 | Cooled “Cold Stick” | 1 |
* Ethanol (95%) | 5 cm3 | Mini-heater | 1 |
** Conc. sulphuric acid | 3 drops | “Distillation Cup” | 1 |
| Test tube | 1 | |
| Small test tube | 1 | ||
| Stand and clamp | 1 | ||
| 10 cm3 measuring cylinder | 1 | ||
| Micro-tip plastic pipette or 3 cm3 disposable syringe | 1 | ||
| Jumbo plastic pipette | 1 | ||
| 10 cm3 measuring cylinder | 1 | ||
| Micro-spatula | 1 | ||
| Electronic balance (± 0.01g) | 1 | ||
| Fine anti-bumping granule | some | ||
| Pin-type thermometer | 1 | ||
* **
(iv) Experimental procedures
| 1. | Using separate clean Pasteur pipettes, transfer 40 drops of 95% ethanol and 60 drops of 100% methanoic acid into a test tube followed by 3 drops of conc. sulphuric acid. Add a small spatula measure of fine anti-bumping granules. |
2. | Clamp the setup and lower it into the mini-heater. Switch on the low voltage power supply. Clamp the prepared “Cold Stick” and lower it into the test tube until the end of the brass rod is about 1 cm above the surface of the solution mixture. Reflux for 30 minutes. |
| 3. | Remove the “Cold Stick” and place the distillation cap with the cup onto the tip of the brass rod. Lower the arranged setup into the test tube again and start distillation. |
| 4. | Wait until the small brass cup has collected enough distillate. Remove the distillation setup from the test tube. Transfer the distillate to a small test tube with the help of a clean micro-tip plastic pipette or a syringe. |
| 5. | Using the pin-type digital thermometer, determine the b.pt. of the distillate. |
(v) Results
Boiling point of distillate = 54.0oC
(Literature value: b.pt. of ethyl methanoate = 54.0oC)
(vi) Conclusion
Micro-scale preparation of ethyl methanoate was performed and the product was determined to be pure ethyl methanoate.
(vii) Remarks
The micro-scale distillation set is very suitable for small scale organic reactions. The idea of water-less condensation not only saves tap water resources, it can also enhance students’ recognition of environmental protection and hence fortify their “Green Awareness”. The design to a large extent shortens the time required for experiment. Naked-flame free heating advantage gives extra credit to safety measures. Reason for using copper and brass as component is because of its easy availability and forming. As the reactivity of copper and brass are low, they are rather resistant to corrosion. Long exposure to low molecular mass organic chemicals makes them passive and more resistant to corrosion.
The set works effectively for boiling point less than 100oC organic chemicals. Increasing current will enhance heating and can cater for temperatures more than 100oC. Placing the “Cold Stick” in a refrigerator can perform reflux for an hour while storing it in a freezer cabinet can perform a 3-hour reflux.
Ester formations are reversible reactions. Ethyl methanoate has a solubility of 9%. Direct distillation after reflux is not a suitable method of obtaining the ester. Percentage yield of this experiment is purposely not included and the aim of the experiment is to identify and test purity of the product
(viii) Internet search
Apart from wine distilleries, one important industrial scale of distillation is the preparation of liquid air and obtain liquid nitrogen and liquid oxygen by distilling liquid air. How do we liquefy air?
The Hampson–Linde cycle is a process for the liquefaction of gases, especially for air separation. William Hampson and Carl von Linde independently filed for patents of the cycle in 1895.
Essential steps of the cooling cycle:
|

B.pt. of liquid oxygen and nitrogen are – 183oC and −196 °C respectively. They can be separated by fractional distillation.
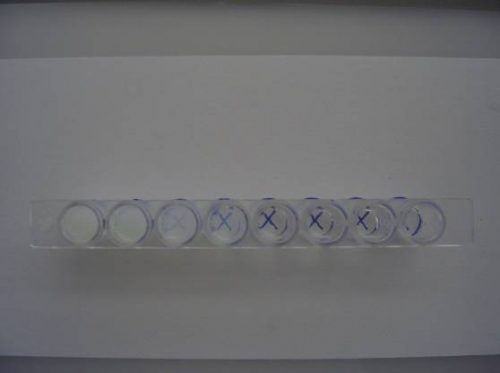
Suggested experiments for “Reaction Disc”
Purpose: Test for sulphur dioxide, chlorine and ammonia for each of the following topics
(i) Acid/base characteristics
(ii) Oxidation/reduction characteristics
(iii) Formation of precipitate
(iv) Formation of complex ions
Expt (3): Acidic and redox properties of sulphur dioxide gas
(i) Objective
Using a “Reaction Disc” to simultaneously test four properties of sulphur dioxide relating to acidity, reduction and bleaching.
(ii) Safety
Generated sulphur dioxide gas is highly toxic and irritating. Never try to inhale it directly. Immediate symptom includes coughing. Students with chronic respiratory problem may trigger asthma. The lab should be well-ventilated. Wear protective mask and safety spectacles. Avoid parts of the body from contaminating chemicals. Information for handling chemicals can refer to Material Safety Data Sheet (MSDS). |
|
(iii) Reagents and equipment
Reagent | Qty | Equipment | Qty |
| *2 M H2SO4(aq) | 5 cm3 | “Reaction Disc” with petri dish | 1 |
| 0.02 M KMnO4(aq) | 5 cm3 | White tile or a sheet of white paper | 1 |
| 0.2 M K2Cr2O7(aq) | 5 cm3 | Combo well plate | 1 |
| Dil. iodine solution | 5 cm3 | Magnifying glass | 1 |
| Sodium thiosulphate | 0.5g | Micro-tip plastic pipette | 4 |
| Universal indicator | 1 cm3 | Jumbo plastic pipette | 4 |
| Deionized water | 10 cm3 | Micro spatula | 1 |
| 50 cm3 beaker for rinsing | 1 | |
*
(iv) Experimental procedures
| 1. | Place two granules of sodium thiosulphate crystal into the central well of the “Reaction Disc”. |
| 2. | Use the following step to prepare a dilute solution of KMnO4: transfer, using a micro-tip pipette, 1 small drop of acidified 0.02 M KMnO4(aq) into a big well of a combo well plate. Using a Jumbo plastic pipette, add 40 drops of deionized water, stir well by a micro spatula. Transfer 10 small drops of the prepared solution to one of the 6 empty peripheral wells. |
| 3. | Prepare a dilute solution of K2Cr2O7: transfer, using a micro-tip pipette, 3 drops of acidified 0.2 M K2Cr2O7(aq) into a big well of a combo well plate. Using a Jumbo plastic pipette, add 20 drops of deionized water, stir well by a micro spatula. Transfer 10 small drops of the prepared solution to an empty peripheral well. |
| 4. | Prepare a dilute solution of universal indicator: add 3 small drops of universal indicator into an empty peripheral well, followed by 7 small drops of deionized water. |
| 5. | Prepare iodine solution: add 10 small drops of dilute iodine solution to an empty peripheral well. |
| 6. | Add, using a Jumbo plastic pipette, 8 drops of 2 M H2SO4(aq) to the central well containing sodium thiosulphate. Place the prepared “Reaction Disc” into the bottom part of the petri dish and cover it with the lid. Place the entire setup on a white tile or a sheet of white paper. Observe with a magnifying glass. |
| 7. | After the experiment, clean all the wells of the “Reaction Disc” with cotton swab moisted with liquid soap. |
(v) Results
Complete the following table:
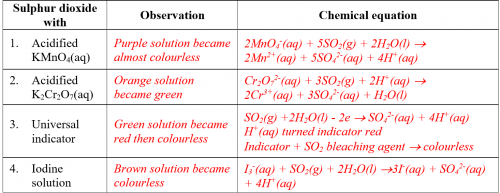
(vi) Question for discussion
Base on experimental results, predict the chemical properties of sulphur dioxide.
Sulphur dioxide gas when dissolved in water is acidic. The aqueous solution is a reducing agent that accepts electrons. It is also a bleaching agent.
Expt (4): Alkaline, redox and bleaching properties of chlorine gas
(i) Objective
Using a “Reaction Disc” to simultaneously test four properties of chlorine gas relating to acidity, oxidation and bleaching.
(ii) Safety
Generated chlorine gas is highly irritating and toxic. Never try to inhale it directly. Students with chronic respiratory problem may trigger asthma. The lab should be well-ventilated. Wear protective mask and safety spectacles. Avoid parts of the body from contaminating chemicals. Information for handling chemicals can refer to Material Safety Data Sheet (MSDS). |
|
(iii) Reagents and equipment
Reagent | Qty | Equipment | Qty |
| * 2 M H2SO4(aq) | 5 cm3 | “Reaction Disc” with petri dish | 1 |
| * Bleaching solution | 5 cm3 | White tile or a sheet of white paper | 1 |
| 0.6 M KI(aq) | 5 cm3 | Combo well plate | 1 |
| 0.5 M FeSO4(aq) | 5 cm3 | Magnifying glass | 1 |
| 0.02 M KMnO4(aq) | 5 cm3 | Micro-tip plastic pipette | 4 |
| Universal indicator | 1 cm3 | Jumbo plastic pipette | 4 |
| Deionized water | 10 cm3 | Micro spatula | 1 |
| 50 cm3 beaker for rinsing | 1 | |
*
(iv) Experimental procedures
| 1. | Place 3 large drops of bleaching solution into the central well. |
| 2. | Prepare dil. KMnO4 solution as follows: using a micro-tip plastic pipette, transfer 1 drop of acidified 0.02 M KMnO4 (aq) into a big well of the combo well plate, follow by 40 large drops of deionized water and stir well. Transfer 10 small drops of the prepared solution to an empty peripheral well. |
| 3. | Prepare a dilute solution of universal indicator: add 3 small drops of universal indicator into an empty peripheral well, followed by 7 small drops of deionized water. |
| 4. | Prepare KI (aq) solution: add 10 small drops of 0.6 M KI (aq) into an empty peripheral well. |
| 5. | Prepare FeSO4 (aq) solution: add 10 small drops of 0.5 M FeSO4 (aq) into an empty peripheral well. |
| 6. | Using a Jumbo plastic pipette, transfer 7 drops of 2 M H2SO4(aq) solution into the central well. Place the prepared “Reaction Disc” into the bottom part of the petri dish and cover it with the lid. Place the entire setup on a white tile or a sheet of white paper. Observe with a magnifying glass. |
| 7. | After the experiment, clean all the wells of the “Reaction Disc” with cotton swab wetted with liquid soap. |
(v) Results
Complete the following table:
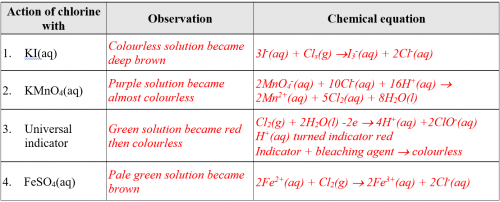
(vi) Discussion
Base on experimental results, predict the chemical properties of chlorine gas.
Chlorine gas when dissolved in water is acidic. The aqueous solution is an oxidizing agent that donates electrons. It is also a bleaching agent.
Expt (5): Alkaline and precipitation properties of ammonia gas (Extension: complex ion formation)
(i) Objective
Using a “Reaction Disc” to simultaneously test six properties of ammonia gas relating to alkalinity, precipitation and complex ion formation.
(ii) Safety
Generated ammonia gas is highly irritating and toxic. Never try to inhale it directly. Students with chronic respiratory problem may trigger asthma. The lab should be well-ventilated. Wear protective mask and safety spectacles. Avoid parts of the body from contaminating chemicals. Information for handling chemicals can refer to Material Safety Data Sheet (MSDS). |
|
(iii) Reagents and equipment
Reagent | Qty | Equipment | Qty |
| ** Conc. ammonia | 5 cm3 | “Reaction Disc” with petri dish | 1 |
| 0.5 M ZnSO4 | 5 cm3 | White tile or a sheet of white paper | 1 |
| 0.5 M AgNO | 5 cm3 | Combo well plate | 1 |
| 0.5 M FeSO4 | 5 cm3 | Magnifying glass | 1 |
| 0.5 M Fe(NO3)3 | 5 cm3 | Micro-tip plastic pipette | 6 |
| *1 M CuSO4 | 1 cm3 | Jumbo plastic pipette | 6 |
| Universal indicator | 1 cm3 | Micro spatula | 1 |
| Deionized water | 10 cm3 | 50 cm3 beaker for rinsing | 1 |
** *
(iv) Experimental procedures
| 1. | Prepare a dilute ZnSO4(aq) solution: add 1 small drop of 0.5 M ZnSO4(aq) into an empty peripheral well followed by 9 small drops of deionized water. |
| 2. | Prepare a dilute CuSO4(aq) solution: add 1 small drop of 1 M CuSO4(aq) into an empty peripheral well followed by 9 small drops of deionized water. |
| 3. | Prepare a dilute AgNO3(aq) solution: add 1 small drop of 0.5 M AgNO3(aq) into an empty peripheral well followed by 9 small drops of deionized water. |
| 4. | Prepare a dilute FeSO4(aq) solution: add 1 small drop of 0.5 M FeSO4(aq) into an empty peripheral well followed by 9 small drops of deionized water. |
| 5. | Prepare a dilute Fe(NO3)3 solution: add 1 small drop of 0.5 M Fe(NO3)3 into an empty peripheral well followed by 9 small drops of deionized water. |
| 6. | Prepare a dilute universal indicator solution: add 1 small drop of universal indicator solution into an empty peripheral well followed by 9 small drops of deionized water. |
| 7. | Inside a fume-cupboard, transfer 8 large drops of conc. ammonia into the central well. Place the prepared “Reaction Disc” into the bottom part of the petri dish and immediately cover it with the lid. Place the entire setup on a white tile or a sheet of white paper. Observe with a magnifying glass. |
| 8. | After the experiment, clean all the wells of the “Reaction Disc” with cotton swab wetted with liquid soap. |
(v) Results
Complete the following table:
(vi) Discussion
Base on experimental results, predict the chemical properties of ammonia gas.
Ammonia gas when dissolved in water is alkaline. The aqueous solution is a precipitating agent. It can form complex ions with Zn2+(aq) or Ag+(aq) to form colourless solutions or Cu2+(aq) to form a deep blue solution.
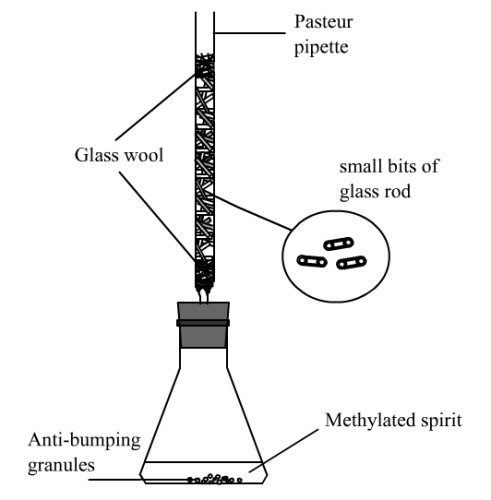
Expt (6): Fractional distillation of industrial methylated spirit (Extension expt.)
Vapour pressure and fractional distillation
(DSE chemistry syllabus does not include the topic of ideal solution and vapour pressure. This extension can be regarded as an enrichment for the topic on petroleum fractional distillation and analytical chemistry.)
(i) Objective
1. To plot a graph of boiling point vs percentage composition for an ideal solution of methanol/water
2. To perform a micro-fractional distillation of a sample of industrial methylated spirit
(ii) Theory and introduction
Due to similar intermolecular forces between solvent/solvent, solute/solute and solute/solvent molecules, vapour pressure of an ideal solution varies linearly with composition (Fig. 187). Normally a more volatile component (with a less b.pt.) has a higher vapour pressure. When boiling of an ideal solution occurs, temperatures of the liquid and the vapour right above it are not the same. The vapour should have a lower temperature because it has the more volatile component. Hence the complete b.pt. vs composition graph is not just a single curve (Fig. 188), but a double curve with a lower liquid curve and an upper vapour cure (Fig. 185).
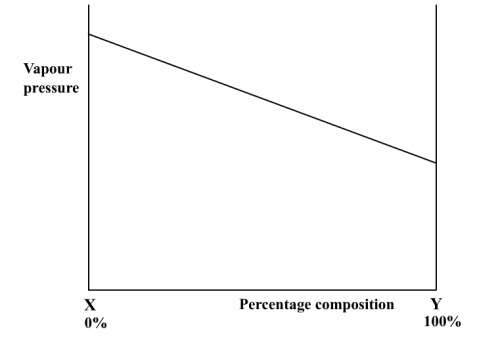 | 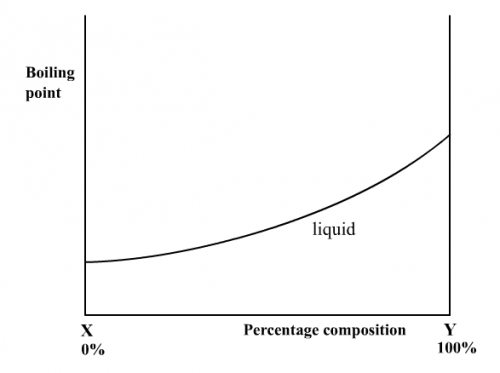 |
(Fig. 187) v.p. vs composition | (Fig. 188) b.pt. vs composition |
Upon first distillation, vapour formed from an ideal solution has a composition rich in the more volatile component. When this vapour is condensed and distilled again (second distillation), the subsequent vapour will be even richer in the more volatile component, as shown in Fig. 189:
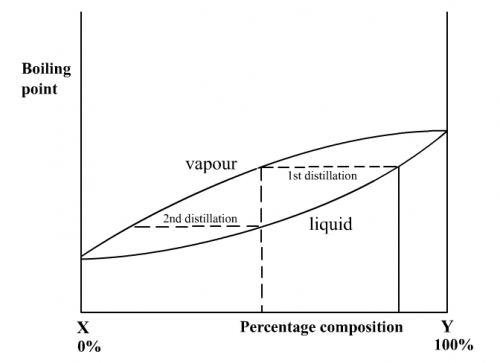
(Fig. 189) Complete b.pt. vs composition
For the experiment, the sample of methylated spirit is a mixture of methanol and water which forms an ideal solution.
(iii) Safety
Wear safety spectacles and avoid skin contact with the chemicals. Use the minimum quantity of materials required. Dispose of chemical waste and excess materials according to your teacher’s instruction. Information for handling chemicals can refer to Material Safety Data Sheet (MSDS). |
|
(iv) Reagents and equipment
Reagent | Qty | Equipment | Qty |
| Industrial methylated violet spirit | 10 cm3 | Micro-scale fractional distillation set | 1 |
| Methanol | 10 cm3 | Test tube | 10 |
| Deionized /distilled water | Suitable | Test tube rack | 1 |
| Anti-bumping granule | 1g | 250 cm3 beaker | 1 |
| Jumbo plastic pipette | 1 | |
| Wash bottle with deionized water | 1 | ||
| Digital thermometer (-50 to 150) oC | 1 | ||
(v) Experimental procedures
a. Boiling point vs composition diagram of a methanol/water mixture
1. Using a beaker water bath, test tube and some anti-bumping granules, the boiling point of 20 drops each of methanol and water are determined
2. Using new test tubes, add drops of water and methanol according to the following scheme:
Test tube | 1 | 2 | 3 | 4 | 5 | 6 | 7 | 8 | 9 |
| No. of drops of methanol | 2 | 4 | 6 | 8 | 10 | 12 | 14 | 16 | 18 |
| No. of drops of water | 18 | 16 | 14 | 12 | 10 | 8 | 6 | 4 | 2 |
3. Determine the boiling point of the contents in each small test tube.
4. Plot a graph of boiling point vs percentage composition of methanol/water. It should look like Fig. 184, if you take methanol as X and water as Y.

b. Micro-scale fraction distillation of commercial methylated spirit
1. Determine the boiling point of the given sample of violet methylated spirit.
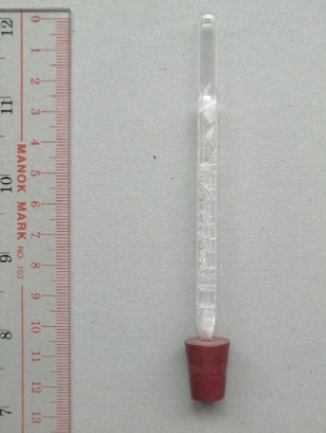
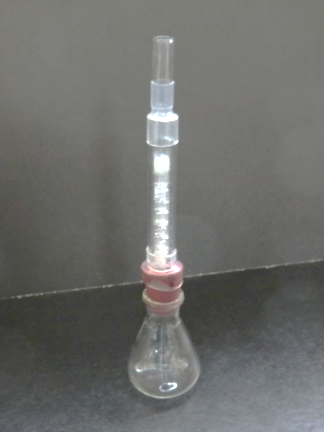
2. Set up the micro fractionating column as shown in the photo of Fig. 192. Place about 5 cm3 of the methylated spirit into the small conical flask and add some anti-bumping granules.
|
|
|
(Fig. 190) Micro-fractional distillation set | (Fig. 191) Micro fractionating column | (Fig. 192) Photo of setup |
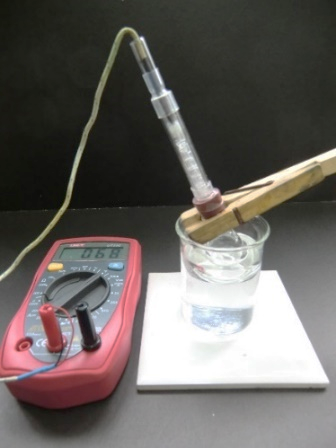 |  |
| (Fig. 193) DMM/thermistor temperature determination | (Fig. 194) Repeated vaporization |
3. Place the setup in a water or sand bath. Wait for boiling and allow time for attaining thermal equilibrium. Determine the boiling point of the liquid collected at the top part of the micro column.
(vi) Results
a. Boiling point vs composition diagram of a methanol/water mixture
Boiling point of methanol = 65oC
Boiling point of water = 100 oC
Test tube | 1 | 2 | 3 | 4 | 5 | 6 | 7 | 8 | 9 | |
Percentage | Methanol | |||||||||
Water | ||||||||||
Boiling point /oC |
| |||||||||
Plot of boiling point vs percentage composition:
b. Micro-scale fractional distillation of commercial methylated spirit
Boiling point of the given sample of methylated spirit = _____________ oC
Boiling point of the fraction at the top of the column = ______________ oC
(vii) Questions for discussion
1. Why is the boiling point/composition graph of an ideal solution not a straight line?
Because composition of solution and composition of the vapour formed are not the same.
2. What do you think is the relationship between the length of a fractionating column and efficiency of separation of components?
The longer the fractionating column, the more effective the separation of components.
3. What will be left in the small flask if the condensed liquid at the top of the column is continuously removed?
Water
4. How would you improve the design of the setup for smoother boiling?
Use a small test tube instead of the small conical flask
5. Name one industrial use of fractional distillation apart from crude oil refinery.
Fractional distillation of liquid air to manufacture liquid nitrogen and liquid oxygen.
(viii) Web search
Connect to the internet and search for information for the following topic:
Latent heat of vaporization
1. Why does the temperature at boiling remain constant?
Heat applied is all used to overcome latent heat of vaporisation needed for vaporisation, no extra heat energy can be provided for raising the temperature of the solution.
2. Describe briefly the function of excess heat removal from human bodies in terms of sweating.
In the absence of acquiring external heat exchange, human bodies need to lower their heat content by themselves. Sweating leading to vaporization requires latent heat of vaporization which is taken from the body. Excess heat of the body fulfills this need. As a result, body temperature can be maintained.
(ix) Conclusion
______________________________________________________________________________________________________________________________________________________________________________________________________________________________________________________________________________________________________________
Expt (7): Properties of carbon dioxide gas
(i) Objective
Use a “S” Tube (Fig. 192) to test carbon dioxide gas
(ii) Safety
Wear safety spectacles and avoid skin contact with any chemicals. Use the minimum quantity of materials required. Dispose of chemical waste and excess materials according to your teacher’s instruction. Information for handling chemicals can refer to Material Safety Data Sheet (MSDS). |
|
(iii) Reagent and equipment
Reagent | Qty | Equipment | Qty |
| *1M HCl(aq) | 10 cm3 | “S” Tube | 1 |
| CaCO3(s) | 1 g | Test tube | 1 |
| Lime water | 5 cm3 | Test tube rack | 1 |
| Deionized water | Suitable amount | Test tube clip | 1 |
| Anti-bumping granule | 0.5g | Jumbo plastic pipette | 1 |
| Wash bottle with deionized water | 1 | ||
| 250 cm3 beaker | 1 | ||
| Spatula | 1 | ||
*
(iv) Experimental procedures
(1) With the help of a Jumbo plastic pipette, place a small amount of lime water into the “U” section of the “S” Tube. Transfer, the help of a spatula, a small amount of solid calcium carbonate into a test tube. Add 20 large drops of 1M HCl(aq) and immediately stopper the mouth of the test tube with the prepared “S” Tube. Warm with a Bunsen burner and observe. Generated gas will force the lime water reagent into the outer bulb but will not overflow. Unpon cooling, cooled air inside the test tube will draw the reagent back to the inner bulb and will not drop into the hot test tube. This way prevents the phenomenon of “sucking back”.
Observation: The lime water turned milky in a matter of seconds.
(2) If the experiment is allowed to carry on for a period of time after the lime water had changed colour, what will happen? Support your explanation by a chemical equation.
Observation:
The milky lime water will eventually turn colourless.
CaCO3(s) + 2HCl(aq) → CO2(g) + CaCl2(aq) + H2O(l)
CO2(g) + Ca(OH)2(aq) → CaCO3(s) + H2O(l)
White ppt
CaCO3(s) + CO2(g) + H2O(l) → Ca(HCO3)2(aq)
Colourless
Expt (8): Properties of sulphur dioxide
(i) Objective
Use a “S” Tube to test sulphur dioxide gas
(ii) Safety
Generated sulphur dioxide gas is highly toxic and irritating. Never try to inhale it directly. Immediate symptom includes coughing. Students with chronic respiratory problem may trigger asthma. The lab should be well-ventilated. Wear protective mask and safety spectacles. Avoid parts of the body from contaminating chemicals. Information for handling chemicals can refer to Material Safety Data Sheet (MSDS). |
|
(iii) Reagent and equipment
Reagent | Qty | Equipment | Qty |
| *1M H2SO4(aq) | 10 cm3 | “S” Tube | 1 |
| Sodium thiosulphate | 1 g | Test tube | 1 |
| KMnO4(aq) solution | 5 cm3 | Test tube rack | 1 |
| Anti-bumping granule | 0.5g | Test tube clip | 1 |
| Deionized water | Suitable amount | Jumbo plastic pipette | 1 |
| Wash bottle with deionized water | 1 | ||
| 250 cm3 beaker | 1 | ||
| Spatula | 1 | ||
*
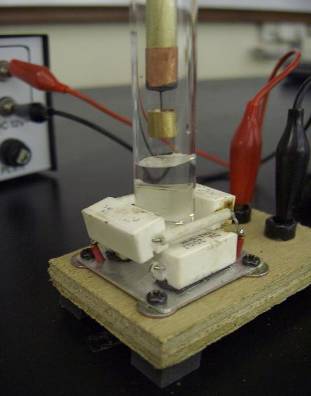
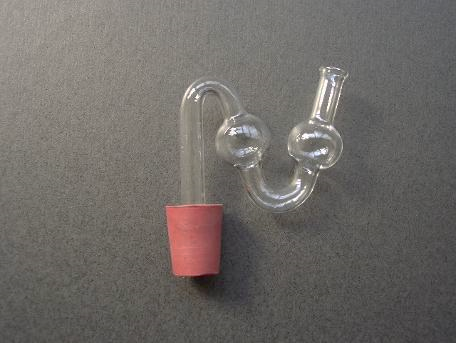 | 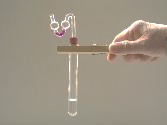 |
| (Fig. 195) “S” Tube | (Fig. 196) Setup for gas testing |
(iv) Experimental procedures
With the help of a Jumbo plastic pipette, place a small amount of KMnO4(aq) solution into the “U” section of the “S” Tube (Fig. 196). Transfer, the help of a spatula, a small amount of solid sodium thiosulphate into a test tube. Add 20 large drops of 1M H2SO4(aq) and immediately stopper the mouth of the test tube with the prepared “S” Tube. Warm with a Bunsen burner and observe.
(v) Observation
Purple KMnO4(aq) solution became almost colourless.
2MnO4-(aq) + 5SO2(g) + 2H2O(l) → 2Mn2+(aq) + 5SO42-(aq) + 4H+(aq)
Purple Pale pink
Expt (9): Migration of ions and electrolysis of dil. NaCl with addition of universal indicator by “Electrolysis stick”
(i) Objective
To detect presence of acidic and alkaline aqueous ions during electrolysis of a dilute solution of NaCl
(ii) Reagent and equipment
Reagent | Qty | Equipment | Qty |
| 0.1M NaCl(aq) | 1 cm3 | “Electrolysis Stick” | 1 |
| Universal indicator | 1 cm3 | Filter paper | 1 |
| A pair of scissors | 1 | ||
| 9 V dry cell | 1 | ||
| Jumbo plastic pipette | 1 | ||
| A small sheet of transparent backing plastic | 1 | ||
| Magnifying glass | 1 | ||
(iii) Experimental procedures
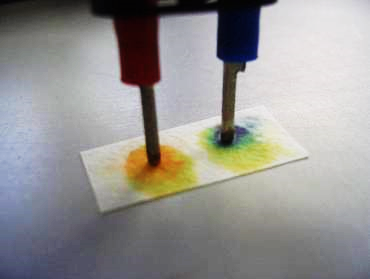
Cut out a small piece of rectangular filter paper from a circular sheet. Rest it on a plastic sheet. Wet the filter paper with two drops of 0.1 M NaCl solution followed by a drop of universal indicator solution. Rest and press the ‘Electrolysis Stick’ capped with a 9V dry cell on the wet filter paper and observe with a handheld magnifier (Fig 197). |
(Fig. 197) |
(iv) Result
Colour at the positive pole (anode) and the negative pole (cathode) changed to ______ (colour) and ______ (colour) respectively.
(v) Conclusion
_______________________________________________________________________________________________________________________________________________________
(vi) Discussion
The phenomenon indicated the presence of H+(aq) ion, which is responsible for acidity, and OH-(aq) ion, which is responsible for alkalinity. Unseen liberation of oxygen and hydrogen is expected. Try to explain the phenomenon by using balanced chemical equations.
Reduction half-equation: 2H+(aq) + e- → H2(g) (H+(aq) migrates to the negative pole)
Oxidation half-equation: 4OH-(aq) – 4e- → O2(g) + 2H2O(l) (OH-(aq) migrates to the positive pole)
Overall redox reaction: 2H+(aq) + 2OH-(aq) → 2H2(g) + O2(g)
(cathode) (anode)
H+(aq) ion, not Na+(aq) ion, is preferentially discharged. Hence H+(aq) ion migrated to the negative pole and imparted red coloration due to presence of universal indicator. H2 was liberated but was not detectable. A dilute solution of NaCl has low concentration of Cl-(aq) ions which will not be discharged. Instead, OH-(aq) ion will be discharged. Hence OH-(aq) ions migrated to the positive pole and imparted a deep blue coloration in the presence of universal indicator. O2 was liberated but was not detectable.
Expt (10): Migration of ions and electrolysis of dil. KI by “Electrolysis stick”
(i) Objective
To detect presence of anion during electrolysis of dilute KI solution
(ii) Reagent and equipment
Reagent | Qty | Equipment | Qty |
| 0.5M KI(aq) | 1 cm3 | “Electrolysis Stick” | 1 |
| Filter paper | 1 | ||
| A pair of scissors | 1 | ||
| 9 V dry cell | 1 | ||
| Jumbo plastic pipette | 1 | ||
| A small sheet of transparent backing plastic | 1 | ||
| Magnifying glass | 1 | ||
(iii) Experimental procedures
Cut out a small piece of rectangular filter paper from a circular sheet. Rest it on a plastic sheet. Wet the filter paper with two drops of 0.5 M KI solution. Rest and press the ‘Electrolysis Stick’ capped with a 9V dry cell on the wet filter paper and observe with a handheld magnifier (Fig 198). |
(Fig. 198) |
(iv) Result
Colour developed at the positive pole (anode) was _______. A metal-like ______ deposit was also observed.
(v) Conclusion
______________________________________________________________________________________________________________________________________________________
(vi) Discussion
Both K+(aq) and I-(aq) are colourless. K+(aq) ion will not be preferentially discharged. Migration of I-(aq) ion towards the positive pole (anode) resulted in the discharge of I-(aq) ion and forms shiny metal-like I2(s). I2(s) dissolves in I-(aq) forms a deep brown complex ion, I3-(aq). Illustrate what had occurred in the experiment with balanced chemical equations.
Reduction half-equation: 2H+(aq) + e- → H2(g) (H+(aq) migrates to the negative pole)
Oxidation half-equation: 2I-(aq) – 2e- → I2(s) (I-(aq) migrates to the positive pole)
I2(s) + I-(aq) → I3(aq)-
Overall redox reaction: 2H+(aq) + 3I-(aq) → I3-(aq) + H2(g)
(deep brown)
H+(aq) ion, not K+(aq)ion, is preferentially discharged. Hence H+(aq) ion migrated to the negative pole. H2 was liberated but was not detectable. I-(aq) ion migrated to the positive pole and I2(s) was liberated (I2(s) is shiny and looks like a metal). I2(s) dissolves in I-(aq) forms a deep brown complex ion, I3-(aq)
Expt (11): Micro-scale kinetic order of acidic oxidation of iodide ion by hydrogen peroxide – “Iodine clock reaction”
(i) Background information
Rate study of the following reaction can be investigated by adding a small fixed amount of sodium thiosulphate and starch indicator.
2O2(aq) + 2I-(aq) + 2H+(aq) → I2(aq) + 2H2O(l)
| H2O2(aq) + 2I-(aq) + 2H+(aq) → I2(aq) + 2H2O(l) | …… main reaction |
| S2O32-(aq) + I2(aq) → S4O62-(aq) + 2I-(aq) | …… monitor reaction |
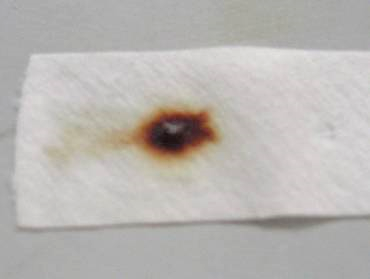
| starch + I2(aq) → deep blue complex | …… indicator reaction |
As shown by the above equations, when a solution mixture containing H2O2(aq), I-(aq), H+(aq) and S2O32- (aq) ions are allowed to react, I2(aq) formed from the main reaction will be consumed and will not impart the added starch indicator blue coloration. When all the S2O32 (aq) ions are consumed, generated I2(aq) will immediately turn the starch indicator deep blue.
Hence, when a mixture of H2O2(aq), I-(aq), H+(aq), S2O32-(aq) and starch indicator is allowed to set aside, nothing will happen. However, after a period of time, the mixture suddenly turns deep blue. The time taken for the appearance of the deep blue coloration is found to be dependent on the amount of S2O32-(aq) present. The more the S2O32-(aq) added, the longer the time. The reaction between I2(aq) and S2O32-(aq) is called the monitor reaction because it controls the time for the experiment to impart the deep blue colour.
Reactions using the above mechanism in rate studies are collectively called “clock reactions”. For example, if bromide ion and methyl orange indicator is used instead of iodide ion and starch, a “bromine clock” will result (figure out related equations yourself).
Kinetics of clock reactions
Time taken for the appearance of deep blue colour (t) reflects the time for the formation of a fixed amount of iodine and the disappearance of iodide ion. Rate of reaction is proportional to 1/t. The shorter the time t, the faster the rate. Hence, a small value of t will result in a situation close to the initial rate (of disappearance of iodide ion) which is the fastest and the true side reaction-free rate (refer to the discussion session). This explains why we should use a small fixed amount of S2O32-(aq) for the clock reaction.
In determining the kinetic order w.r.t. I-(aq), the concentrations of H2O2(aq) and H+(aq) are kept fixed and the concentration of the I-(aq) ion varies according to a 1:2:4:8 ratio. If the observed rate also increases in the same proportional ratio, then according to definition, the order w.r.t. I-(aq) is 1. On the other hand, if the detected rates show no change, then a zero order is expected.
Using the same method, orders w.r.t. H2O2(aq) and H+(aq) can be determined. This innovative method is called the “1 2 4 8” Technique.
(ii) Objective
To determine the kinetic order of the reaction between an acidified solution of potassium iodide and hydrogen peroxide w.r.t.
a. I-(aq),
b. H2O2(aq) and
c. H+(aq).
(iii) Safety
Wear safety spectacles and avoid skin contact with chemicals. Dispose of chemical waste and excess materials properly. Information for handling chemicals can refer to Material Safety Data Sheet (MSDS). |
|
(iv) Reagent and equipment
| Reagent | Qty | Reagent | Qty |
| 0.60M H2SO4 | 5 cm3 | 8-well reaction strip | 2 |
| 0.60M KI | 5 cm3 | Micro-tip plastic pipette | 1 |
| 1.50% H2O2 | 5 cm3 | Stop watch | 1 |
| 0.08M Na2S2O3 | 5 cm3 | *Micro stirrer | 1 |
| Starch indicator | 5 cm3 | 250 cm3 beaker with deionized water for rinsing | 1 |
| Deionized water | 10 cm3 |
* Not suitable to use tooth picks as they are contaminated with bleaching agents
(v) Experimental procedures
Kinetic order w.r.t. I-(aq)
| 1. | Transfer, with the help of a clean micro-tip plastic pipette, one drop each of 1.5%H2O2(aq), 0.6M H2SO4(aq) and starch indicator to the first four separate wells of a 8-well reaction strip. So that each well receives a total of 3 drops. Call this strip (A). |
| 2. | Take another strip, strip (B), again using a fresh and clean micro-tip pipette, transfer 1 drop of 0.08 M Na2S2O3(aq) to each of the first 4 wells. |
| 3. | Into the same 8-well reaction strip (B), place 1 drop of 0.6 M KI(aq) to the first well, 2 drops to the second, 4 drops to the third and 8 drops to the fourth. Add 7 drops of deionised water to the first well, 6 drops to the second and 4 drops to the third so that the total number of drops of reactant mixture in each of the 4 wells of strip B is 9. (see Table 1) |
| 4. | Stir the solution mixture in each of the wells of strip B with micro stirrer. |
| 5. | Carefully invert strip B and stack it atop strip A so that the first 4 wells of strip B are directly above the first 4 wells of strip A. |
| 6. | Hold the two strips firmly together by means of two rubber bands, one at each end. Hold the strip combination with one hand and lower it suddenly (“shake-down” technique) so that solutions of strip (B) fall into strip (A) (Figure 199). Start the stop watch at the same time. Alternatively. not using rubber bands, the same procedure can be performed with two hands, as shown in Fig. 200. |
| 7. | Turn the strip combination upside down repeatedly and look for the sudden appearance of a deep blue colour. Record the time taken. Carry on recording time until all the 4 wells have developed colour in correct sequence. |
| 8. | Clean the reaction strips thoroughly with deionized water and empty the water in the wells |
|
|
(Fig. 199) One-hand “shake-down” with rubber bands holding strips A and B | (Fig. 200) Two-hand “shake-down” with no rubber bands |
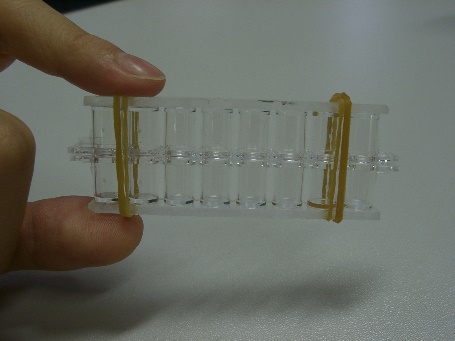
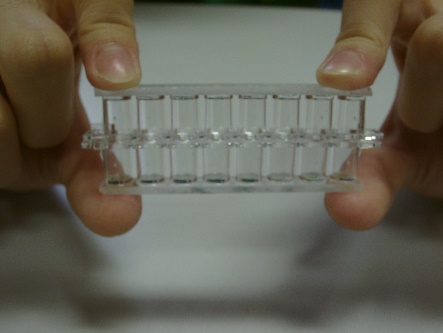
Table (1)
| No. of small drops | ||||||
| Strip A | Strip B | |||||
| Well | H2O2(aq) | H2SO4(aq) | Starch indicator | I-(aq) | H2O(l) | 0.08M S2O32-(aq) |
| 1 | 1 | 1 | 1 | 1 | 7 | 1 |
| 2 | 2 | 6 | ||||
| 3 | 4 | 4 | ||||
| 4 | 8 | 0 | ||||
Kinetic order w.r.t. H2O2(aq)
Repeat the above procedures according to Table (2)
Table (2)
| No. of small drops | ||||||
| Strip A | Strip B | |||||
| Well | I-(aq) | 0.08M S2O32-(aq) | Starch indicator | H2O2(aq) | H2O(l) | H2SO4(aq) |
| 1 | 1 | 1 | 1 | 1 | 7 | 1 |
| 2 | 2 | 6 | ||||
| 3 | 4 | 4 | ||||
| 4 | 8 | 0 | ||||
Kinetic order w.r.t. H+(aq)
Repeat the above procedures according to Table (3)
Table (3)
| No. of small drops | ||||||
| Strip A | Strip B | |||||
| Well | I-(aq) | 0.08M S2O32-(aq) | Starch indicator | H2SO4(aq) | H2O(l) | H2O2(aq) |
| 1 | 1 | 1 | 1 | 1 | 7 | 1 |
| 2 | 2 | 6 | ||||
| 3 | 4 | 4 | ||||
| 4 | 8 | 0 | ||||
(vi) Results
| Variable | Relative concentration | t (s) | Rel. initial rate /t (s-1) | Expected kinetic order |
| [I-(aq)] | 1 | 104 | 0.96 x 10⁻² | 1 |
| 2 | 55 | 1.8 x 10⁻² | ||
| 4 | 28 | 3.6 x 10⁻² | ||
| 8 | 14 | 7.1 x 10⁻² | ||
| [H2O2(aq)] | 1 | 115 | 0.87 x 10⁻² | 1 |
| 2 | 58 | 1.7 x 10⁻² | ||
| 4 | 29 | 3.4 x 10⁻² | ||
| 8 | 14 | 7.1 x 10⁻² | ||
| [H+(aq)] | 1 | 102 | 0.98 x 10⁻² | – – – |
| 2 | 72 | 1.4 x 10⁻² | ||
| 4 | 51 | 2.0 x 10⁻² | ||
| 8 | 26 | 3.8 x 10⁻² |
Note:
(1) If the initial rate doubles as the concentration doubles, the kinetic order w.r.t. the reactant is 1.
(2) Experimental error caused by using micro-scale amount of reactants is usually large and there is a need to repeat the experiment and average the results.
(vii) Conclusion
____________________________________________________________________________________________________________________________________________________________________________________________________________________________________________________________________________________________________________
(viii) Questions for discussion
Does the appearance of deep blue colour mean the main reaction is completed?
No. Appearance of deep blue colour signifies the time taken to produce a certain amount of product, i.e. I2(aq). After this, the main reaction still goes on.
2. With reference to the main reaction, explain, with the help of a graph, the meaning of “initial rate”.
Decay curve of the iodide ion of the main reaction:
H2O2(aq) + 2I-(aq) + 2H+(aq) → I2(aq) + 2H2O(l)
is shown below (Fig. 198). Three rate terms need to be clarified: (i) average rate = [I-(aq)] consumed / time taken, (ii) instantaneous rate at time t = slope of the decay cure at time t and (iii) initial rate = slope of the decay curve at time 0. They are not the same, the fastest being initial rate.
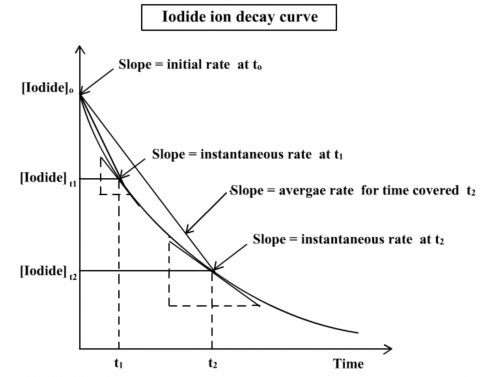
(Fig. 201) Iodide ion decay curve
3. Explain: “t has to be small in order to obtain initial rate”
As shown in Fig. 201, measured rates are average rates involving time t1 or t2. If t is small enough, then the average rate can be taken as initial rate. Initial rate is defined as the instantaneous rate at time zero
4. Why initial rate and not instantaneous rate is considered for experimental measurement?
Time for the appearance of deep blue colour indicates a small amount of iodine is formed from the start. In other words, this average rate is taken as the initial rate of the main reaction, provided that time required is small. Average rate is determined experimentally while instantaneous rate is deduced graphically from the slope of the decay curve plot, after the experiment has finished. Also, at the start of the reaction, side reactions or other interferences are less possible, so measurement of initial rate is more desirable than average rate or instantaneous rate at time t.
5. Explain why the amount of S2O32-(aq) added has to be small.
Added S2O32-(aq) can be looked upon as a gate which limits the amount of H2O2(aq) or I-(aq) for initial reaction. In fact, it functions to consume the I2(aq) formed and prevents the starch indicator from changing colour. When all S2O32-(aq) is used up, the colourless solution mixture immediately turns deep blue, indicating the end of investigation (but the main reaction goes on, until completion). The lesser the amount of S2O32-(aq), the smaller the amount of H2O2(aq) or I-(aq) to complete the investigation and hence the shorter the time. Under such situation, time for appearing deep blue is shortened and satisfy the criterion for initial rate measurement. However, t should not be smaller than 5 sec., otherwise keeping time would be difficult.
6. Base on all the kinetic orders found, write a concentration rate equation.
 = k[I-(aq)][H2O2(aq)]
where k, the rate constant, is a constant for particular reaction at affixed temperature (commonly used 298 K). For the iodine clock reaction, it is the rate of the main reaction when the concentrations of I-(aq) and H2O2(aq) are both equal to 1 mol dm-3.
7. According to the main reaction: H2O2(aq) + 2I-(aq) + 2H+(aq) → I2(aq) + 2H2O(l)
Why can’t the rate equation be expressed stoichiometrically as
 = k[I-(aq)]2[H2O2(aq)][H+(aq)]2?
The quantitative function of a balanced equation is to calculate the amount of product formed by considering the stoichiometric coefficients. From the main reaction, one mole of acidified H2O2 (aq) react with 2 moles of KI (aq) to form one mole of I2(aq). Information as such has nothing to do with rate of the reaction. Rate equation has to do with “elementary reaction” and not the overall reaction. The following question deals with how “elementary reaction” determines the rate of a reaction.
8. The main reaction is proposed to consist of the following 3 elementary reactions:
| H2O2(aq) + I-(aq) → X + H2O(l) | ……(slow) |
| H+(aq) + X → Y | ……(fast) |
| Y + H+(aq) + I‑(aq) → I2(aq) + H2O(l) | ……(fast) |
In order to validate the proposal of![]() = k[I-(aq)][H2O2(aq)], what should be X and Y?
= k[I-(aq)][H2O2(aq)], what should be X and Y?
X = OI-(aq), Y = HOI(aq)
The slow elementary reaction is the rate-determining step, the other two fast ones can be neglected as far as rate is concerned. Hence:
 = k[I-(aq)][H2O2(aq)]
Which is exactly the same as the experimental rate.
(ix) Remarks
Advantages in using micro-scale instrument in this experiment instead of traditional apparatus include:
(a) Replacing volume by drops shortens time spent in calculation. There is no need to consider concentration in unit of mol dm-3.
(b) 4 separate experiments can be performed at the same time. Finishing time can be as short as just more than 1 minute.
(c) The simplified procedure facilitates students to understand and grasp the fundamental objective of the experiment.
2. The “1 2 4 8” Technique
The technique is essentially a non-graphical method of rate study. As its name implies, the concentration of the targeted reactant for investigation is purposely varied separately in a ratio of 1:2:4:8, keeping the concentration of other reactants constant. If the measured reaction rate also varies in the same ratio of 1:2:4:8, then according to first order reaction criterion, the reaction is a first order reaction w.r.t. the targted reactant. If the measured reaction rate varies as (1)2: (2)2:(4)2:(8)2, the reaction is a second order reaction. If the measured reaction rate remains the same, the reaction is a zero-order reaction. According to the DSE Syllabus, reactions to be studied are either first order or zero order.
3. Don’t be misled by the term “iodine clock reaction” which is not a standalone reaction. It is in fact a method of investigating the reaction rate of the oxidation of iodide ion by hydrogen peroxide in acidic medium by the addition of suitable amounts of thiosulphate ion and starch indicator. As the reaction involves colour change (colourless to brown), colorimetry using a colorimeter is another commonly used method of investigating the reaction rate of the redox reaction. Refer to Experiment (25) of the program for details of determining the kinetic order of the reaction.
iodine clock
Expt (12): Micro-scale quantitative analysis of the reaction rate of acidification of sodium thiosulphate – the “Disappearing cross experiment”
(i) Objective
To investigate the dependence of rate of the reaction between S2O32-(aq) and H+(aq) on concentration of reactants.
2. To establish a rate equation for the reaction.
(ii) Introduction
Balanced chemical equation between sodium thiosulphate and dil. Sulphuric acid:
S2O32-(aq) + 2H+(aq) → S(s) + SO2(g) + H2O(l)
Rate equation for the reaction can be expressed as:
Rate = k([S2O32-(aq)] n) ([H+(aq)]m)
Keeping [S2O32-(aq)] fixed during reaction, order w.r.t. H+(aq) i.e. m, can be determined. Alternatively, keeping [H+(aq)] fixed during reaction, order w.r.t. S2O32-(aq) i.e. n, can also be determined. This method is called “pseudo-order” determination.
For the experiment, the tracking reactant is S2O32-(aq) and the variable to be considered is the time taken to produce a fixed amount of S(s). Method adopted is to make use of the phenomenon of precipitation of opaque sulphur can cause a cross witten on a paper to disappear. The time for the disappearance of the cross is the time required to form a fixed amount of sulphur.
Micro-scale approach is used in the experiment involving 8-well reaction strip. The “continuous variation” method and the “shake-down” technique are employed.
(iii) Safety
| Wear safety spectacles and avoid skin contact with chemicals. Dispose of chemical waste and excess materials properly. |  |
(iv) Reagent and equipment
| Reagent | Qty | Reagent | Qty |
| * 0.25M Na2S2O3 (aq) | 5 cm3 | 8-well reaction strip | 2 |
| * 1M H2SO4(aq) | 5 cm3 | Micro-tip plastic pipette | 4 |
| Deionized water | 5 cm3 | 50cm3 beaker | 4 |
| White paper or Light table | 1 | ||
| Stopwatch | 1 | ||
| Micro-stirrer | 5 | ||
| Cotton swab | 5 | ||
| Ball pen or Pencil | 1 | ||
*
(v) Experimental procedures
(a) Effect of varying concentration of S2O32-(aq)
1. According to the table below and using two clean micro-tip plastic pipettes, place (i) drops of 0.25M Na2S2O3 (aq) and (ii) drops of deionized water into each of the 7 wells of a 8-well reaction strip. Call this strip (A).
| Strip A | A1 | A2 | A3 | A4 | A5 | A6 | A7 | A8 |
| No. of drops of Na2S2O3 (aq) | 1 | 2 | 3 | 4 | 5 | 6 | 7 | 8 |
| No. of drops of Deionized water | 7 | 6 | 5 | 4 | 3 | 2 | 1 | 0 |
2. According to the table below and using two clean micro-tip plastic pipettes, place (i) 7 drops of 1M H2SO4 (aq) and (ii) 2 drops of deionized water into each of the 7 wells of a 8-well reaction strip. This is trip (B).
| Strip B | B1 | B2 | B3 | B4 | B5 | B6 | B7 | B8 |
| No. of drops of 1M H2SO4(aq) | 7 | 7 | 7 | 7 | 7 | 7 | 7 | 7 |
| No. of drops of Deionized water | 2 | 2 | 2 | 2 | 2 | 2 | 2 | 2 |
3. Place an empty 8-well reaction strip on a piece of white paper, sketch a contour of the shape of the strip and mark a cross (X) against the position of each of the 8 wells.
4. Carefully invert strip A and rest it on top of strip B so that wells of each strip are facing one another precisely.
5. Slowly raise the two strips and lower them suddenly (“shake-down” technique) so that contents of strip A drops completely into strip B and mix with that of strip B. Start the stopwatch.
6. Remove strip B and place it over the marked sheet of paper, make sure the wells cover the crosses completely.
7. Record the time for the sequential disappearance of each cross (Fig. 202).
8. To avoid colloidal sulphur deposit after the experiment (which is hard to clean after the experiment), wash and tidy each well with a bit of liquid soap and cotton swab. Immerse the cleansed strip in fresh tap water.
(Fig. 202) Disappearance of crosses
(b) Effect of varying concentration of H+(aq)
9. According to the following table and by using clean micro-tip plastic pipettes, place drops of 1M H2SO4(aq) and deionized water into separate cleansed wells of strip A.
| Strip A | A1 | A2 | A3 | A4 | A5 | A6 | A7 | A8 |
| No. of drops of 1M H2SO4(aq) | 1 | 2 | 3 | 4 | 5 | 6 | 7 | 8 |
| No. of drops of Deionized water | 7 | 6 | 5 | 4 | 3 | 2 | 1 | 0 |
10. According to the following table, by using clean micro-tip plastic pipettes, place drops of 0.25M Na2S2O3 (aq) and deionized water into separate cleansed wells of strip B.
| Strip B | B1 | B2 | B3 | B4 | B5 | B6 | B7 | B8 |
| No. of drops of Na2S2O3 (aq) | 7 | 7 | 7 | 7 | 7 | 7 | 7 | 7 |
| No. of drops of Deionized wate | 2 | 2 | 2 | 2 | 2 | 2 | 2 | 2 |
11. Repeat steps (4) to (8).
(vi) Results
Complete the table below:
| Expt (a) | Expt (b) | ||||
| Concentration ratio of S2O32-(aq) | t(s) | 1/t(s-1) | Concentration ratio of H2SO4(aq) | t(s) | 1/t(s-1) |
| 1 | 1 | ||||
| 2 | 2 | ||||
| 3 | 3 | ||||
| 4 | 4 | ||||
| 5 | 5 | ||||
| 6 | 6 | ||||
| 7 | 7 | ||||
| 8 | 8 | ||||
(vii) Treatment of data
Input the data of the above table into the MicroSoft Excel spreadsheet page with columns labelled as t and 1/t. Plot a X-Y scatter diagram and display a decay curve for S2O32-(aq) and H+(aq) respectively.
(viii) Discussion and conclusion
1. What is “continuous variation” method?
“Continuous variation” method is a special technique of dilution. With reference to the experimental procedure (a) step (1), drops of reagent are prepared in the ratio of 8: 7: 6: 5: 4: 3: 2: 1 while drops of water are sequentially added in the ratio of 0: 1: 2: 3: 4: 5: 6: 7. Thus, the final concentration decreases linearly in the ratio of![]() If the total volume does not maintain constant, then the actual concentration has to be calculated after each addition of water.
If the total volume does not maintain constant, then the actual concentration has to be calculated after each addition of water.
2. List one other way of following the rate of the reaction.
Measure change of pH values during reaction
(Note: not suitable to consider collecting SO2, as the gas is quite soluble in water)
3. Briefly describe the pattern in which S2O32-(aq) and H+(aq) changes with time.
Rate of reaction is proportional to concentration change of S2O32-(aq).
Rate of reaction is independent of concentration change of H+(aq).
4. Find, from the two plots, the kinetic order w.r.t. S2O32-(aq) and H+(aq).
First order w.r.t.S2O32-(aq) and zero order w.r.t.H+(aq).
5. Write a rate equation for the reaction.
Rate = k[S2O32-(aq)]
(ix) Internet search
Find, from relevant websites, one fast and one slow chemical reaction. Nuclear reaction is not considered as a chemical reaction as it concerns nuclear radiactive decay and does not involve rearrangement or combination of electrons to form compounds, as all chemical reactions do.
Slow reactions: formation of stalactite and stalagmite / formation of rocks / rusting of iron
Fast reactions: explosions / airbag instantaneous reaction
(x) Conclusion
_____________________________________________________________________________________________________
_____________________________________________________________________________________________________
How do airbags work
Expt (13): Determination of the activation energy of the iodine clock reaction
(i) Objective
To determine the activation energy of the oxidation reaction between acidified hydrogen peroxide and potassium iodide.
(ii) Introduction
A typical way of performing an iodine clock reaction is to use the oxidation reaction between acidified hydrogen peroxide and iodide compounds, with thiosulphate ion acting as monitor reagent. It is illustrated as follows:
| 2I-(aq) + 2H+(aq) + H2O2(aq) → I2(aq) + 2H2O(l) | ……main reaction |
| I2 (aq) + 2S2O32-(aq) → 2I-(aq) + S4O62-(aq) | ……monitor reaction |
| I2(aq) + starch → deep blue complex | ……indicator reaction |
Iodine formed from the main reaction will be immediately consumed by a small amount of thiosulphate ion and will not affect the starch indicator. After a short period of time, when all the thiosulphate ion has been used up, appearance of iodine will impart a deep blue coloration to the solution mixture. The time taken for the drastic colour change is the time taken to form a fixed small amount of iodine.
This kind of reaction usually takes the form of mixing two groups of solution mixtures. One group consists of acidified H2O2 (aq) + S2O32-(aq) and the other consists of I-(aq) and starch indicator. Reaction will take place at 30oC, 40℃, 50oC and 60oC respectively. Record the time for the appearance of a deep blue colour.
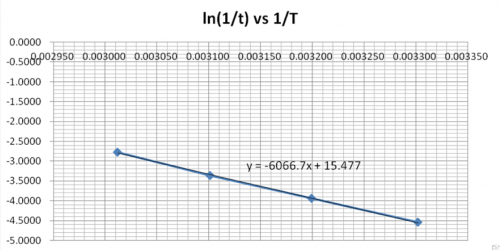
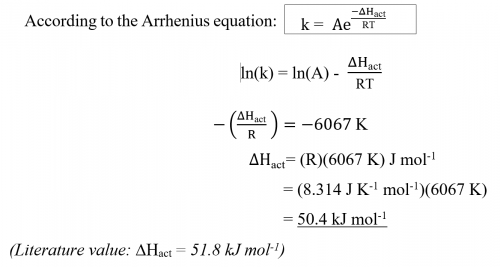
According to the Arrhenius equation: k = or ln(k) = ln(A) –
![]() , a plot of ln(
, a plot of ln(![]() ) vs (
) vs (![]() ) should be a straight line with a negative slope of
) should be a straight line with a negative slope of ![]() . A value of ΔHact can be deduced.
. A value of ΔHact can be deduced.
(iii) Safety
Wear safety spectacles and avoid skin contact with chemicals. Use minimum amount of reagents. Dispose of chemical waste and excess materials properly. |
|
(iv) Reagent and equipment
| Reagent | Qty | Equipment | Qty |
| FA 1*: (10 cm3 0.6M H2SO4 + 2.5 cm3 6.5% H2O2) diluted to 90 cm3 | 90 cm3 | Mini heater | 1 |
| FA 2*: (10 cm3 0.6M KI + 10 cm3 0.08M S2O32- + 20 cm3 0.2% starch) diluted to 90 cm3 | 90 cm3 | 12V DC power supply | 1 |
| Boiling tube | 2 | ||
| 600 cm3 beaker | 1 | ||
| 25 cm3 measuring cylinder | 1 | ||
| 0-110oC thermometer | 1 | ||
| Stopwatch | 1 | ||
*
(v) Experimental procedures
| 1. | Transfer 10 cm3 FA 1 to a boiling tube, label it as A. |
| 2. | Transfer 10 cm3 FA 2 to another boiling tube, label it as B. |
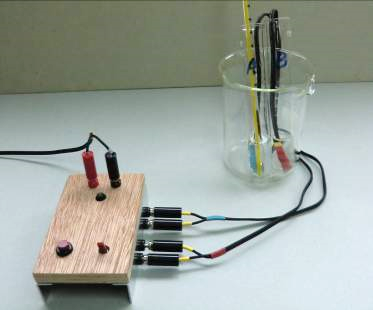
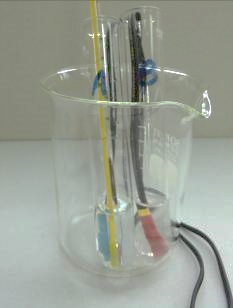
| 3. | Place A and B into a 250 cm3 beaker for the purpose of heat insulation. Completely insert one probe of the heater into A and another probe into B. Place a thermometer into one of the boiling tubes (Fig. 204). |
| 4. | Switch on the mini heater by pressing the toggle switch (Fig. 203). Constantly hand stir the probes and observe for sights of temperature rise. |
| 5. | When the temperature is near 57oC, switch off the power supply. Next, press repeatedly the red Push-on ON/OFF switch until temperature registered is exactly 60oC for a minute. |
| 6. | Pour contents of FA 1 into FA 2. Start the stopwatch when half of the solution has been transferred. |
| 7. | With an accuracy of ± 0.01 second, record the time for the sudden appearance of a deep blue colour. |
| 8. | Measure the temperature again after finishing the experiment. |
| 9. | Repeat the experiment at 50oC. 40oC and 30oC. |
|
|
(Fig. 203) Mini heater base-set with 2 heater probes for the experiment | (Fig. 204) Boiling tubes/beaker/ heater probes combination |
Special notice: Like all household electric boilers, never switch on the power supply when the probes of the mini heater are not immered in aqueous solutions.
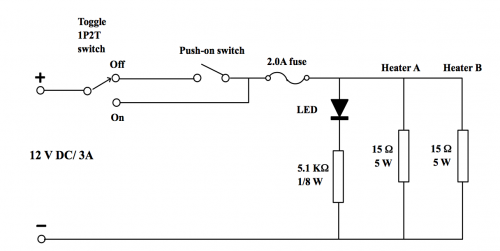
(Fig. 205) Mini heater circuit
(vi) Data
Rate of the reaction can be expressed as:
“Rate” = ![]()
![]()
Complete the following table:
| Expt | Initial temp / K | Final temp / K | Average temp (T) / K | Reaction time t / s | “rate”’ = / s-1 |
| 1 | 333.0 | 331.0 | 332.0 | 16 | 0.0625 |
| 2 | 323.0 | 322.0 | 322.5 | 29 | 0.0345 |
| 3 | 313.0 | 312.3 | 312.7 | 51 | 0.0196 |
| 4 | 303.0 | 302.7 | 302.9 | 94 | 0.0106 |
(vii) Data treatment
| Expt | Average temp (T) / K | 1/T | ( | (ln |
| 1 | 332.0 | 0.003012 | 0.0625 | -2.7726 |
| 2 | 322.5 | 0.003101 | 0.0345 | -3.3673 |
| 3 | 312.7 | 0.003199 | 0.0196 | -3.9332 |
| 4 | 302.9 | 0.003302 | 0.0106 | -4.5433 |
Plot (ln![]() ) vs 1/T and deduce
) vs 1/T and deduce![]() ,ie. Ea, from the slope of the graph.
,ie. Ea, from the slope of the graph.
According to the Arrhenius equation: | k = |
(viii) Questions for discussion
1. Explain whether ![]() is positive or negative.
is positive or negative.
![]() is positive. That means heat energy is absorbed to overcome
is positive. That means heat energy is absorbed to overcome![]() so that reacton can proceed.
so that reacton can proceed.
2. Base on the calculated value of ![]() is the reaction fast or slow? Does the sudden colour change agree with experimental finding? What reaction rate is the experiment actually measured?
is the reaction fast or slow? Does the sudden colour change agree with experimental finding? What reaction rate is the experiment actually measured?
A reaction with ΔHact = 50.4 kJ mol-1 is not considered as a fast reaction. Sudden appearance of colour has nothing to do with the rate of the main reaction. Monitor, indicator and main reaction are different reactions which take place at the same time. Appearance of deep blue colour indicates amount of S2O32-(aq) has all consumed and the product iodine reappears. It represents the time to form a fixed amount of iodine which is controlled by S2O32-(aq). ΔHact is for the main reaction only.
3. Explain whether or not ![]() is dependent on temperature.
is dependent on temperature.
ΔHact is not dependent on temperature.
4. What factor affects activation energy?
Catalyst. Presence of a suitable catalyst can lower activation energy of a reaction.
5. Is there a relationship between reaction rate and rate constant (k)?
According to: Rate = k [reactant] n, if concentration of reactant is 1 mol dm-3 and n = 1, then measured reaction rate is k.
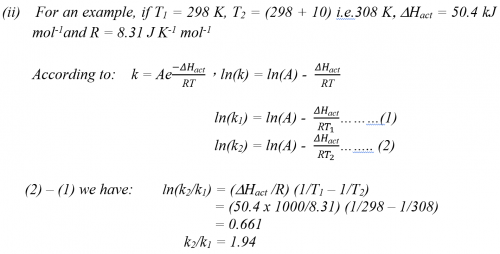
6. A “rule of thumb” method of assessing effect of concentration on reaction is: reaction rate doubles for every increase in 10oC. Explain whether or not this is reflected by the finding of the experiment.
(i) Experimental result is in agreement with the “rule of thumb”.
| Average temp/ K | ( |
| 332.0 | 0.0625 |
| 322.5 | 0.0345 |
| 312.7 | 0.0196 |
| 302.9 | 0.0106 |
7. List 3 factors affecting rate of reactions (excluding state of reactants).
Concentration, temperature and catalyst
8. Name two possible drawbacks in the Experimental procedures and equipment construction and methods to improve them.
| Source | Ways to minimize drawback | |
| Procedure | Solutions A and B are not mixed with the same speed Slow reaction time for recording colour change | Repeat experiment Let student with a faster reaction time to take time |
| Equipment | Thermometer inaccurate Temperatures of A and B are not the same | Check with other thermometers Select resistors of exactly the same value for probe construction |
(ix) Conclusion

(x) Internet search
Inorganic catalysts are widely used in industrial low yield reactions, notably the Haber and the Contact processes. Enzymes are organic catalysts, which can exist naturally or artificially synthesized as special proteins. Studies of human enzymes become more and more important, notably in drug innovations. Find, from relevant websites, mechanisms of interaction of various enzymes on human bodies. View information on “Enzyme inhibitor”, “Proenzyme”, “Methotrexate” and “Chiral protein inhibitor” You
Expt (14): Micro-scale determination of the Gas Constant (R) at r.t.p.
(i) Objective
To determine the relative molecular mass of butane and hence a value for the gas constant R.
(ii) Pre-lab internet search
1. Find, under the condition of 1 atmospheric pressure and at a room temperature of 25oC, a value for the density of nitrogen and chlorine gas.Nitrogen gas density = 1.15 g dm-3, chlorine gas density = 2.95 g dm-3
2. Propose a means of relationship between volume and mass of gas.Plot a graph of vol. of gas vs mass of gas
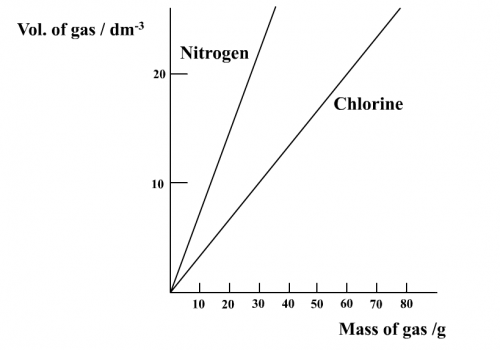
3. Deduce, from the above graph, a value for the volume of 1 mole of the gas.1 mole of N2 (28 g), volume = 24 dm3
1 mole of Cl2 (71 g), volume = 24 dm3
If the result can be generalized to other gases, i.e. r.t.p. molar volume of all gases equals to 24 dm3, What would you suggest to do?
Try other gases such as readily accessible CO2 or butane gas (C4H10) of gas lighters.
(iii) Equipment description
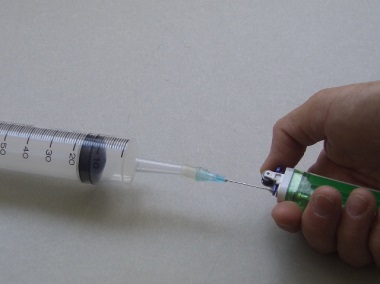
The designed micro-scale RMM kit (Fig. 206) is a simple but innovative method of determining the r.t.p. RMM of butane gas (C4H10). Butane gas contained in a commercial cigarette gas lighter is allowed to be released, with the help of a hypodermic needle, into a 60 cm3 plastic syringe (Fig. 207). Mass of butane gas liberated is determined by weighing the lighter before and after the experiment. Having obtained the mass and volume data of a gas, molar volume at r.t.p. or R, the gas constant can be calculated, assuming an available value of RMM. Alternatively, knowing r.t.p. molar volume of 24 dm3, R and RMM can also be calculated.
| (Fig. 206) Micro-scale RMM kit | (Fig. 207) Releasing butane gas |
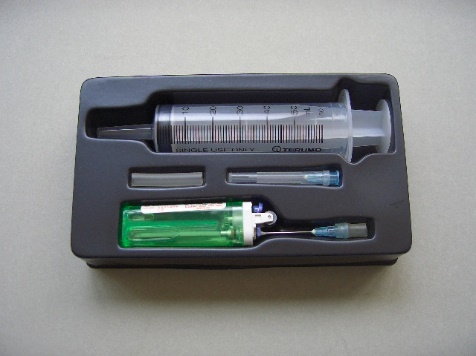
(iv) Material and instrument
Micro-scale RMM kit includes:
1. A 60![]() plastic disposable syringe,
plastic disposable syringe,
2. A butane cigarette lighter with its nozzle sealed, with AA glue, to a hypodermic needle,
3. A spare hypodermic needle and
4. A section of silicone tubing.All placed in a vacuum-formed plastic tray (Fig. 203).
(v) Experimental procedures
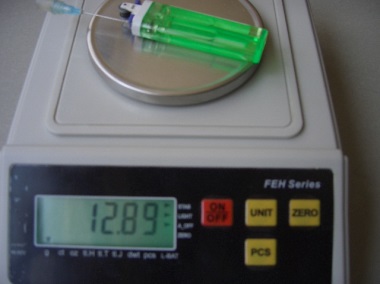
1. Weigh out the mass of gas lighter with the attached needle to an accuracy of ± 0.01 g (Fig. 208).
2. Press and release butane gas from the lighter until of volume of 60 cm3 of the gas is collected (Fig. 209).
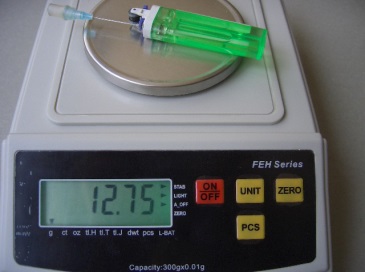
3. Remove the lighter needle combination from the syringe. Weigh it again (Fig. 210).
4. Assuming RMM of butane is 58g mol-1, calculate a value for the molar volume of butane at r.t.p. Compare with literature value.
5. Assuming room temperature is 250C and atmospheric pressure to be 101325Pa, calculate a value for R, the gas constant and compare it with literature value.
| (Fig. 208) | (Fig. 209) | (Fig. 210) |
Release butane gas
(vi) Results and calculation
Initial mass of lighter combination = 12.89 g
Final mass of lighter combination = 12.75 g
Mass of released butane = (12.89 – 12.75) g = 0.14 g
No. of mole of butane = 0.14/58 = 0.002414
Volume of butane collected = 60![]()
Volume of 1 mole of butane = [60 x ] cm3 = 24855 cm3
(Standard molar volume at r.t.p. = 24000![]() )
)
Experimental percentage error =  = 3.6%
Any experimental error less than 5% are regarded as acceptable.
According to the ideal gas equation: PV = nRT
We have:
P = 101325 N/m-2, V = 60 cm3= 6×10⁻⁵ m3, T = (25+273) K = 298 K and n = 0.00241 mol
Substituting above data into the gas equation PV = nRT:
(101325N/m-2)(6 x 10-5 m3) = (0.00241mol) R (298K)
R = 8.465 Nm K-1 mol-1 (4 sig. figures)
= 8.465 J K-1 mol-1
(Literature value: R = 8.314 J mol-1), %error = +1.8%
Another condition in which molar volume refers to is Standard Temperature and Pressure, s.t.p. Calculate, using the mathematical relationship V1/T1 = V2/T2 , a value of molar volume at s.t.p.
V1 = 24855 cm3, T1 = 298 K,
V2 =?cm3, T2 = 273K
(24855 cm3)/(298 K) = (?cm3) / (273 K)
? = 22770 cm3 = 22.77 dm3
Experimental molar volume at s.t.p. is calculated as 22.77 dm3
(v) Questions for discussion
1. Explain why we called gas equation as “ideal”. What is the meaning for “ideal”? What is “real”?
Ideal gas equation is based on the assumption of: (i) intermolecular force does not exist and (ii) molecules do not have volume. The “real” case is (i) intermolecular force exists and (ii) molecules occupy volume.
2. Briefly explain under what situation can we assume real gases to be “ideal”.
Under very high temperature and very low pressure, we can assume real gases behave ideally. This is because gaseous molecules under such situation are far apart.
3. How do we perform calculation for real gases?
Deviation from ideal behaviour – The corrected equation for PV = nRT is known as van der Waal’s equation: [P + a(n/V)2] (V – nb) = nRT, where a and b are correcting constants for intermolecular forces and volume of molecules respectively.
(vi) Internet search
View different websites and find a literature value of molar volume at s.t.p. correct to 4 significant figures.
r.t.p. molar volume | s.t.p. molar volume |
24.47 dm3 |
(vii) Conclusion
____________________________________________________________________________________________________________________________________________________________________________________________________________________________________________
Expt (15): Qualitative and quantitative analysis of electrolysis of water by using the “Electrolysis Tube”
(i) Objective
1. To collect liberated gases by the electrolysis of an aqueous solution of dil. NaOH
2. To test collected gases
3. To measure em.f. of the prepared alkaline hydrogen / oxygen fuel cell
(ii) Introduction
Electrolysis of an electrolytic solution is the decomposition of the electrolyte by DC electric current. It is a redox reaction. Electrolysis of a solution of dilute NaOH liberates hydrogen gas at the negative pole (cathode) and oxygen gas at the positive pole (anode). Volume ratio of hydrogen to oxygen is 2 : 1.
Cathode: 4H+(aq) + 4e –> 2H2(g)
Anode: 4OH-(aq) – 4e –> O2(g) +2H2O(l)
Overall redox reaction: 2H+(aq) + 2OH-(aq) –> 2H2(g) + O2(g)
Liberated oxygen gas relights a glowing splint and hydrogen gas gives the “pop” sound test.
(iii) Safety
Wear safety spectacles and avoid skin contact with chemicals. Use minimum amount of reagents. Dispose of chemical waste and excess materials properly. |
|
(iv) Reagent and equipment
Reagent | Qty | Equipment | Qty |
| * 0.5 M NaOH(aq) | 100 cm3 | “Electrolysis Tube” | 1 |
| 9V dry cell | 2 | ||
| DMM | 1 | ||
| Jumbo plastic pipette | 1 | ||
| Bits of “Blu Tack” | 2 portions | ||
| Butane gas lighter | 1 | ||
| Disposable gloves | 1 pair | ||
| 9V battery cap with connecting wires | 1 | ||
| Wooden splint or incense stick | 1 | ||
| 100 cm3 beaker | 1 | ||
| Crocodile clip with wire | 2 | ||
*
(v) Experimental procedures
(a) Ratio of hydrogen to oxygen
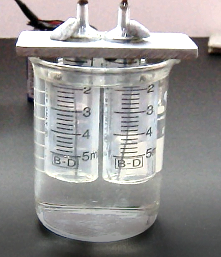
1. Place suitable amount of 0.5 M NaOH into a 100 cm3 beaker. Rest the “Electrolysis Tube” (Fig. 211) on the beaker (Fig. 212). Adjust the aqueous level so that the position of the meniscus is at about the 2 cm3 mark.
2. Use the two bits of “Blu Tack” to seal the tiny holes near the top of the syringe barrel (Fig. 212). Lift the setup a bit and see if the two meniscus levels still stay at the 2 cm3 mark (Fig. 213). This step ensures no leakage of gas.
3. Cap the two 9V dry cells and connect the power source to the setup leads. Start electrolysis (Fig. 214)
4. Allow experiment to proceed for about a minute until 1.5 cm3 of gas in the anode compartment has been collected. Record the volume of gas collected at the cathode compartment (Fig. 212). A Petri dish can be used to collect the overflow electrolyte.
| (Fig. 211) | (Fig. 212) | (Fig. 213) | (Fig. 214) |
Preparation and start for electrolysis
Ratio of vol. of O2 to H2
| (Fig. 215) | (Fig. 216) |
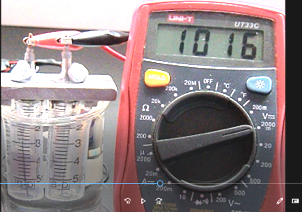
(b) Meaurement of e.m.f. of the generated alkaline hydrogen/oxygen fuel cell
1. Remove the batteries, immediately measure the p.d. developed across the leads. The measured p.d can be regarded as the e.m.f. of a freshly generated alkaline hydrogen/oxygen fuel cell. Value of the measured p.d. will drop quickly (Fig. 216). This is because the cell formed has a very high internal resistance and provides little current which will be consumed quickly. Revise the V = iR relationship.
Generated alkaline H2/O2 fuel cell
(c) Test for hydrogen gas
1. Put on the gloves. Lift the setup above the electrolyte, close the cathode compartment with one finger. Turn the setup upside down and bring it near a butane flame. Remove the finger, hear and observe.
“Pop” sound test
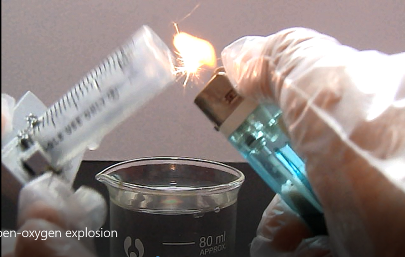
(d) Test for a mixture of hydrogen and oxygen
1. Repeat steps (1) to (4). When the experiment has proceeded halfway, exchange the polarity the voltage supply such that the cathode becomes the anode and vice versa.
2. Continue electrolysis until the two plastic tubes collect 3 cm3 of a mixture of gases.
3. Lift the setup above the electrolyte. Bring it close to a butane flame and watch out for a stunning loud sound (Fig. 217).
(e) Test for oxygen gas
(Fig. 217) | (Fig. 218) |
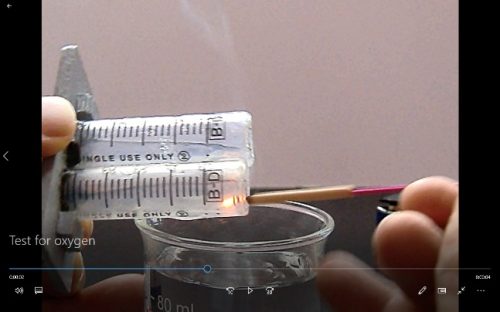
1. Repeat the experiment from the very beginning. This time remove the “Blu-Tack” sealing the cathode compartment. This result in electrolysis for the anode only. Wait till the anode compartment is filled with the liberated gas. Prepare a glowing incense. Lift the setup and insert the glowing incense into the plastic barrel containing the gas and observe (Fig. 215).
Test for oxygen gas
(vi) Results and conclusion
(a) DC current decomposes dilute solutions of NaOH,NaCl,H2SO4 and liberates ___________ gas at the anode and ____________ gas at the cathode. Overall result is the decomposition of water into______________ and _______________.
Complete redox equation of electrolysis of water:
______________________________________________________________________________________________________________________
(b) Internet information indicates the e.m.f. of an alkaline hydrogen oxygen fuel cell is +1.23 V. Result obtained from the simple fuel cell of Expt (15) was _______ V.
(c) The “pop” sound test is a classical test for ______________ gas.
(d) Explosion of a mixture of hydrogen and oxygen gas is far more destructive than a single hydrogen gas explosion.
(e) Oxygen gas relights a glowing splint. It is one of the ______ factors necessary for combustion.
(vii) Remarks
- Dilute NaOH solution was employed as electrolyte. This is because other electrolytes such as dil. NaCl or dil. H2SO4 would corrode or oxidize the nichrome wire anode electrode.
- Nichrome wire was adopted as electrode because it is very resistant to corrosion or oxidation. It would not corrode under water. It gets red hot when current is allowed to pass through and returns to its original state immediately after cooling to room temperature.
- Gas liberation generates bubbles and makes the meniscus level less conspicuous. One way to overcome this is to remove the batteries and stop electrolysis for a while. The meniscus level will reappear more clearly.
- Not suitable to use moving needle voltmeter for e.m.f. measurement. High input resistance instrument should be used. All commercial inexpensive DMM (digital multi-meter) offers at least 10 MW (107 W) input resistance and takes up very little current from the power source. Voltage display of DMM can be taken as cell e.m.f.
- The design offers a simple and portable device for qualitative and quantitative investigations of electrolysis. No venue limitation. It is an ideal introduction set for the topic on electrolysis.
(viii) Discussion
Explain why the e.m.f. measured in step (b) dropped so quickly.
Standard reduction potential of oxygen: O2(g) +2H2O(l) + 4e –> 4OH-(aq) fE/V=+1.23V
Standard reduction potential of hydrogen: 2H+(aq) + 2e –> H2(g) fE/V= 0.00 V
Cell diagram of an alkaline fuel cell consisting of two half-cells:
Theoretical speaking, e.m.f. of an alkaline hydrogen oxygen fuel cell is 1.23 V. The initial voltage of the simple fuel cell formed by the experiment was 1.02 V, much lower than the expected value of 1,23 V. This has to do with:
(A) (i) Electrode employed was not the inert platinum metal, (ii) the cell was not composed of two independent half-cells, (iii) apart from hydrogen and oxygen other impurities could also be generated;
(B) The simple Alkaline hydrogen oxygen fuel cell formed in procedure step (b) has a very high internal resistance. According to the formula of V = iR, the cell can only provide a very small amount of current which will be quickly consumed once it is connected to an instrument, e.g. a voltmeter or even a DMM. This results in a quick drop of p.d. during measurement. Revise Program (1) Topic 8.2 on Simple formulae calculations p.73-74 “instrument loads the source signal”.
(ix) Internet search
In the 80’s of last century, some scientists claimed they observed nuclear fusion by electrolyzing heavy water D2O at room temperature. The finding shocked the entire scientific field. Scientists normally accept nuclear fusion can occur only at extreme high temperature and pressure, like what is happening inside the sun.
D + T → He + n.
Hot fusion of deuterium (2H) and tritium (3H) atoms to form helium (4He) and neutron (1n) releases tremendous amount of heat energy which is of paramount importance to our future daily energy consumption. The announcement received lots of feedback but was soon silenced, mainly because the result was irreproducible. Try to find from websites the ins and outs of the whole issue of “cold nuclear fusion” and follow-up attempts for possible limited applications.
“Cold fusion” refers to nuclear fusion that can take place near room temperature (or less than 100 K) pressure and employing simple devices. During nuclear fusion, light nuclei fuse together to form heavy nuclei accompanying release of huge amount of heat energy.
In 1989, Martin Fleischmann and Pons Stanley declared that they had succeeded in sustaining nuclear fusion by electrolyzing heavy water at room temperature using palladium and platinum electrodes. They used simple electrolysis device with 99.5 % D2O and 5% H2O as electrolyte together with the addition of a small amount of LiD. The liquid was placed in a 20.32 cm test tube at 27oC with a palladium rod as cathode and a platinum rod as anode. After passing current, deuterium ion gathered at the cathode fused together and released particles typical of a nuclear fusion, i.e. tritium, neutron and γ ray, accompanying heat release. The heat released was 4 times more than that of the experiment consumed. They regarded the phenomenon as “cold fusion”. However, a lot of scientists tried to repeat the experiment but were not able to get the expected results. People tended to believe the whole issue was just a scam.
Years later, some tried to pick up the issue again but on a smaller scale with a view of establishing a mobile energy source. No publications of importance on the topic were observed as of today.
Expt (16): Determination of the Standard enthalpy change of combustion ΔHΦcomb of propanol
(i) Objective
To determine the standard enthalpy change of combustion ΔHΦcomb of propanol by using a micro-scale instrumental device
(ii) Introduction to method employed
Complete combustion of propanol forms carbon dioxide, water and releases heat:
2C3H7OH (l) + 9O2(g) –> 6CO2(g) + 8H2O (g) ΔHΦcomb = -2020 kJ mol-1
Micro-scale determination of the enthalpy change of combustion of propanol needs a simple but innovative calorimeter. The way to do it to use an aluminium block to receive heat generated from the propanol placed in a small glass bowl. Data to be collected includes: mass of the propanol burnt and temperature rise.
Most school calorimetric experiments use water and spirit burner. The conventional method is to heat up the water by burning the alcohol placed in the spirit burner. Calculation of heat of combustion is based on the formula ΔH = (ms) ΔT. This “single experiment calibration” approach. e.g. substituting only literature value of s for calculation, has a lot of drawbacks. The main source of error is due to heat loss to the environment, making experimental ΔT unreliable. Although this can be corrected theoretically by plotting a cooling curve and apply Newton’s law of cooling (internet search) or experimentally by improving heat insulation, procedures required is time consuming.
The “dual experiment calibration” approach involves two experiments on burning two alcohols instead of one. This method can do away with correction for DT or heat loss to the environment. Main points of the method are as follows: Use a handy aluminium block instead of water accompanying a container, adopt a literature value of standard enthalpy change of one alcohol and a measurement of temperature rise.
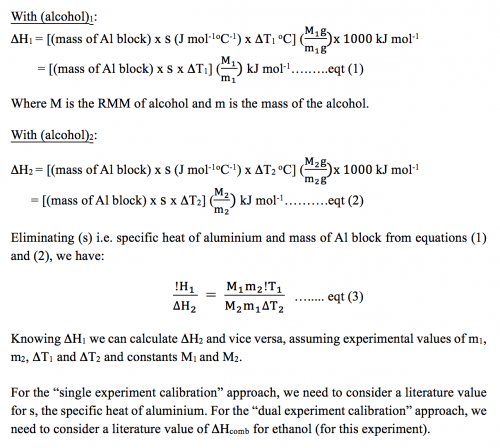
(iii) Safety
Wear safety spectacles and avoid skin contact with chemicals. Use minimum amount of reagents. Dispose of chemical waste and excess materials properly. |
|
(iv) Reagent and equipment
Reagent | Qty | Equipment | Qty |
| * Ethanol | 1 cm3 | Micro-scale heat of combustion kit | 1 |
| * Propanol | 1 cm3 | Thermometer | |
| Jumbo plastic pipette | 1 | ||
| Electronic balance, resolution (± 0.001g) | 1 | ||
| Gas lighter | 1 | ||
*
(v) Experimental procedures
(a) Burning ethanol
| 1. | Place 5 drop of ethanol into the small glass bowl and record the mass. |
| 2. | Record the initial temperature of the aluminium block. |
| 3. | Light the ethanol with the gas lighter and put the small glass bowl under the aluminum block. Keep burning until all the ethanol has been consumed. Record the highest temperature. |
| 4. | Cool the block below water and bring it to room temperature. |
(b) Burning propan-1-ol
| 5. | Repeat steps (1) to (4) with propan-1-ol. |
(Fig. 219) Aluminium block with small cylindrical glass bowl | (Fig. 220) Sizes of the kit, digital thermometer and a ball pen | (Fig. 221) Experimental setup |
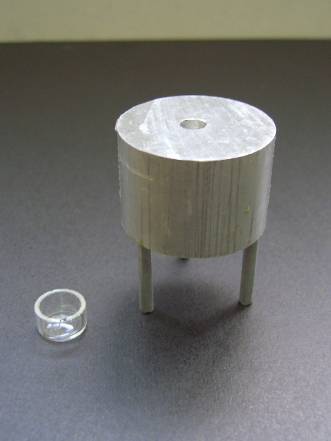
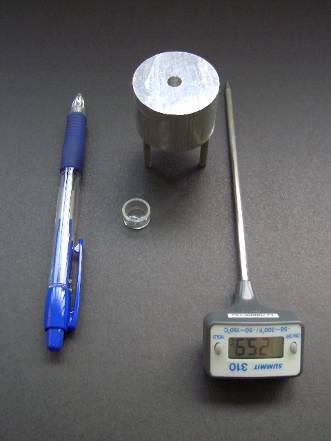
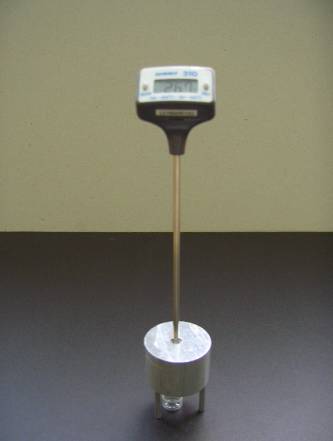
(v) Results
Expt (a): Mass of ethanol (m1) = 0.0875 g
Initial temperature = 28.9 oC
Final temperature = 40.0 oC
ΔT1 = (40.0 – 28.9) = 11.1 oC
Expt (b): Mass of Propanol (m2) = 0.0925 g
Initial temperature = 28.8 oC
Final temperature = 43.7 oC
ΔT2 = (43.7 – 28.8) = 14.9 oC
(vi) Calculation
Literature values:
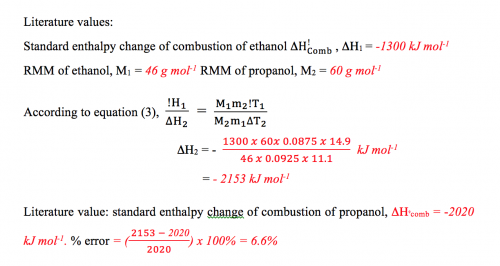
(vii) Conclusion
________________________________________________________________________________________________________________________________________________________________________________________________________________________
(viii) Remarks
* Micro-scale kit as such has no venue limitation.
* Experiment should be performed in a low air circulation environment, as heat loss is enhanced by air current.
* Incomplete combustion contributes to experimental drawback. Check that no yellow flame should be observed.
(ix) Discussion
1. Propose a theoretical consideration to eliminate heat loss to surrounding.
If we adopt the “single experiment” approach, heat the block, record the maximum temperature rise, remove the flame and continue the experiment, the heating curve will display a rise and then fall, due to cooling by the surround (see the diagram below). Applying Newton’s law of cooling, heat loss to the surrounding is proportional to the excess temperature, we can calculate the amount of heat loss during the experiment. Add this to the actual heating curve and obtain the ideal heating curve with no heat loss. The later part of the ideal curve is flat, indicating no change of temperature or no loss of heat to the surrounding. The observed maximum temperature rise, ΔT is less than the temperature rise corrected for cooling, ΔT’.
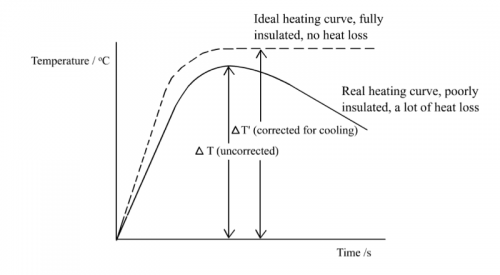
Thus, the formula for enthalpy change calculation ΔH= (ms)ΔT, which is not corrected for heat loss to the surrounding, should be modified to ΔH= (ms)ΔT’.
2. For the “dual experiment calibration” approach, heat capacity, ms, is not considered in calculation. In other words, error due to weighing of the mass of aluminium block does not exist. The method needs a literature value of Δ![]() for one of the alcohols. Experimental error (+6.6%) using this method still exists. Suggest a way to minimize source of error of the method.
for one of the alcohols. Experimental error (+6.6%) using this method still exists. Suggest a way to minimize source of error of the method.
Adjust the mass of ethanol and propanol burnt so that the two alcohols give the same temperature rise. This literally means the two experiments are carried out in exactly the same heating environment, any heat loss will be mutually cancelled.
(x) Internet search
Did you notice when the Long March 3 series of rockets were launched, a lot of brown gas emitted at the start of ignition. What exactly was this brown gas? Is it toxic? The rocket carries what kind of fuel? Is there a better choice of fuels?
All space rockets carry their own burning fuels and oxidants, as the outer space is totally vacuum. Most rocket engines carry hypergolic propellants in which the component combinations spontaneously ignite when they come into contact with each other.
Hydrazine (N2H4) is a commonly used fuel for rockets. Its heat of combustion ΔHfcomb = -621 kJ mol–1 is rather low, but when used with a readily available greenish liquid oxidant, dinitrogen tetroxide N2O4, the two acts as a powerful liquid propellant with high specific impulse. Hypergolic propellant as such was widely adopted as fuel for launching space satellites. Overall combustion equation:
2N2H4 (l) + N2O4(l) –> 3N2(g) + 4H2O(g)
The intermediate product, NO(g), is quickly oxidized by air to from the brown gas NO2(g). N2O4(l) and NO2(g) also establish chemical equilibrium: N2O4(l) <–> 2NO2(g). Long March 3 series of rockets use unsymmetrical dimethylhydrazine (UDMH; 1,1-dimethylhydrazine) as the hydrazine derivative fuel. Therefore, when the Long March 3 series of rockets were launched, a lot of brown toxic NO2 gas was formed during terrestrial ignition. The gas causes acid rain and is harmful to the environment.
The improved version of Long March series of rocket, the Long March 5 series, uses liquid oxygen and kerosene as propellant. Specific impulse of the new engine design was greatly enhanced. Coupled with unharmful propellants and products of combustion, the Long March 5 series of rockets meet environmental conservation demands.
Since the last decade, the US had been actively engaged in developing, NASA with commercial enterprise efforts, liquid methane / liquid oxygen rocket engines. The prime purpose is to colonize Planet Mars. For a round trip to and from Mars, fuel for the return rocket has to be produced on the Planet. Atmosphere of Mars has 95% CO2, and by using the Sabatier process (internet search), CO2 and H2 (by electrolysis of H2O, collected from the combustion of methane) react to form CH4. View internet information on Rapter rocket engine, SpaceX and Starship.
Expt (17): Antimony combination electrode for pH measurement using a sensor and “One-point calibration”
(i) Introduction
Measurement of pH of aqueous solutions is basically the measurement of cell e.m.f. formed by a special pair of electrodes placed into the solution. Today, nearly all electrodes fabricated for pH measurement employ an electrode sensitive to concentration of H+(aq) ion, i.e. a glass membrane electrode and a reference electrode using silver/silver chloride immersed in a buffered gel. These kind of pH electrodes are available commercially as glass combination electrodes. Such pH glass combination electrodes are expensive, albeit fabricated with advanced technology and with decent market demands. Schools using multiple sets of such kind of pH meter for experiments often have budget problems, let alone glass electrodes have limited lifetime and are vulnerable to breakage. Recently, antimony electrode was re-discovered as a surgical equipment for pH measurement, primarily because of its ability to be miniaturized and functions accurately in the pH range of 6 to 8 (blood is a kind of aqueous solution buffered at pH 7.4). Revise Topic 5.1 on “Antimony pH meter”
(ii) Objective
1. To prepare a Sb and Cu/Cu2+ combination electrode
2. Using the self-devised pH sensor mentioned in Topic 5.1 and the “One-point calibration” method to calibrate an antimony pH meter for pH measurement
(iii) Reagent and Equipment
Reagent | Qty | Equipment | Qty |
| * 1M CuSO4 | 1 cm3 | Antimony electrode and copper / CuSO4(sq) reference electrode | 1 pair |
| Buffer solutions of pH 2, 4, 7, 10, 13 | 10 cm 3 | pH sensor with connecting cables | 1 set |
| Universal indicator | 1 cm 3 | Jumbo plastic pipette | 5 |
| Micro-tip plastic pipette | 1 | ||
| 24-well plate | 1 | ||
| 250 cm3 beaker with deionized water | 1 | ||
| DMM with connecting cables | 1 | ||
| “salt-plug” | 3 | ||
| Small piece of sand paper | 1 |
*
(iv) Experimental procedures
1. Preparation of Sb and Cu/Cu2+ combination electrodeWith the help of a micro-tip pipette, fill the small chamber of the glass tubing of the reference electrode with 1 M CuSO4 solution until the solution overflows and exhibits a meniscus curvature (Fig. 222, 223). Close the opening by forcing a bit of “salt-bridge” (Fig. 224). No air bubble is allowed inside the chamber, otherwise current conduction will be hindered and cause unstable signal. Figure 225 shows a finished set of the combination electrode.
(Fig. 222) | (Fig. 223) | (Fig. 224) | (Fig. 225) |
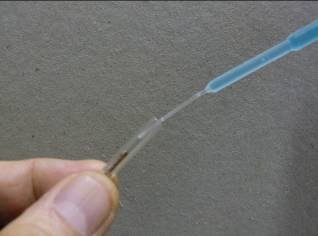
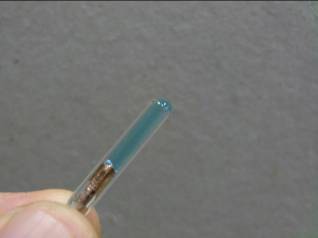
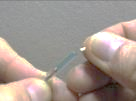
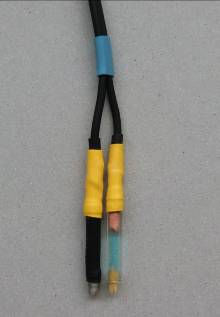
2. Sand the antimony tip with a piece of sand paper.
3. Transfer, with the help of a Jumbo plastic pipette, 20 drops each of buffer solutions of pH 2, 4, 7 10 and 13 into 5 separate wells of a 24-well plate. Add to each well 3 drops of universal indicator.
4. Connect the prepared antimony combination electrode to the pH sensor banana socket and the sensor DC plug to a DMM with suitable cables. Select the DC 2000 mV range for full display. Switch on the pH sensor.
5. Place the antimony combination electrode into the pH 7 well, stir and wait for a while to attain redox equilibrium.
6. Adjust the knob of the sensor until the DMM displays a value of 70 mV. Stop turning and fix the position of the knob. Having done this, the sensor is “One-point” calibrated against pH 7.0. The setup is ready for pH measurement.
7. Place the antimony combination electrode in a pH 2 buffer, the DMM will display 20 mV. If a pH 4 buffer is used, the reading will be 40 mV and so on. This innovative method is the “DMM Display Technique”. The displayed value is taken as the experimental result with no unit.
8. Fig. 226 shows an antimony pH electrode is “One-point” calibrated at pH 7.0.
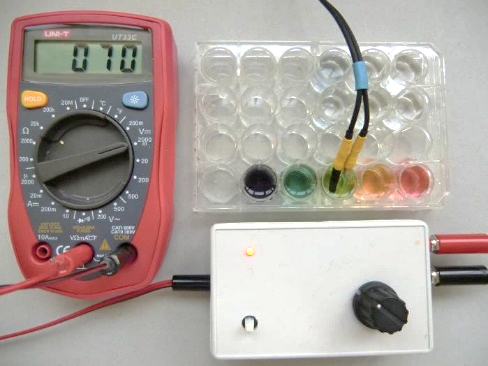 (Fig. 226) pH 7.0 “One-point calibration”
Expt (18): 0.1M HCl vs 0.1M NaOH (strong acid vs strong base) titration curve
(i) Objective
Using a calibrated antimony combination electrode pH meter and the “DMM Display Technique”, plot a strong acid vs strong base titration curve.
(ii) Reagent and equipment
Reagent | Qty | Equipment | Qty |
| * 1M CuSO4 | 1 cm3 | Sb/Cu,Cu2+combination pH electrode with connecting cable | 1 pair |
| * 0.1 M HCl | 10 cm 3 | pH sensor | 1 |
| * 0.1 M NaOH | 10 cm 3 | Pasteur pipette | 5 |
| pH 7 buffer solution | 10 cm 3 | Jumbo plastic pipette | 1 |
| Universal indicator | 1 cm 3 | Micro-tip plastic pipette | 1 |
| Phenolphthalein indicator | 1 cm 3 | 24-well plate | 1 |
| 250 cm3 beaker with deionized water | 1 | |
| DMM with cable | 1 | ||
| “salt-plug” | 3 | ||
| A small piece of sand paper | 1 | ||
| Access to a computer installed with the spreadsheet “Excel” software | — | ||
*
(iii) Experimental procedures
(a) Preparation of Sb/Cu, Cu2+ combination electrode and “One-point calibration”
Repeat Expt. (17) setups 1 – 6 for the preparation of the combination electrode. Use buffer solution pH = 7.00 for “One-point calibration”.
(b) pH titration curve
| 1. | Transfer, with the help of a clean Pasteur pipette, 25 drops of 0.1 M HCl into a well of a 24-well plate, followed by a large drop of phenolphthalein indicator. |
| 2. | Connect the antimony combination pH electrode cable to the sensor input and the output to a DMM set at the DC 2000 mV full scale range. Switch on the pH sensor. |
| 3. | Place the pH electrode into the well containing 25 drops of 0.1 M HCl. |
| 4. | Stir the electrode for a couple of seconds, stop for another 30 seconds and record the steady pH value displayed by the DMM. |
| 5. | Fill the same cleansed Pasteur pipette with 0.1 M NaOH. Transfer the content dropwise to the reaction well. Observe the change in display values and record each one of them sequentially. Observe also the accompanying colour change. |
| 6. | Continue titration in this manner until 40 drops of 0.1 M NaOH had been added. |
(iv) Results
Drops of 0.1 M NaOH | pH | Drops of 0.1 M NaOH | pH |
0 | 1.5 | 21 | 2.2 |
1 | 1.5 |
|
|
2 | 1.5 | 23 | 2.3 |
3 | 1.5 | 24 | 2.7 |
|
| 25 | 3.2 |
5 | 1.5 | 26 | 9.3 |
|
| 27 | 10.6 |
7 | 1.6 | 28 | 10.9 |
9 | 1.6 | 30 | 11.3 |
11 | 1.6 | 32 | 11.3 |
13 | 1.8 | 34 | 11.5 |
15 | 1.8 | 36 | 11.5 |
17 | 1.8 | 38 | 11.6 |
19 | 2.0 | 40 | 11.6 |
(v) Treatment of data
1. Activate the spreadsheet “Excel” software. Establish data columns of no. of drops and pH values.
2. From the main menu click “Insert” and choose the “Graph” icon.
3. Select the X-Y scattered diagram option
4. Streamline axes parameters and build a decent appearance of a pH titration curve.
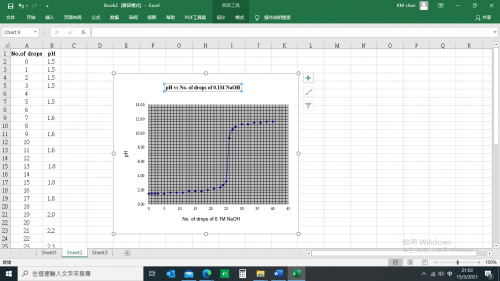
(vi) 0.1 M HCl vs 0.1 M NaOH titration curve
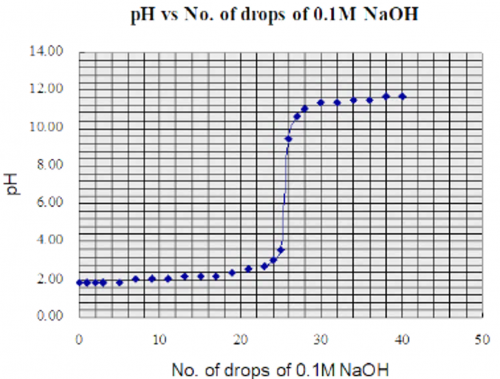
(vii) Question for discussion
Why should a Pasteur pipette and not a plastic pipette be used for the dropwise titration?
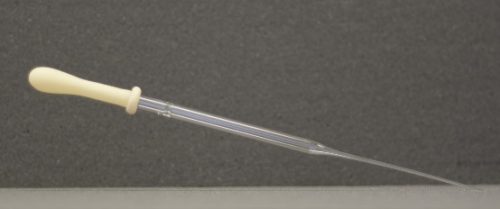 | 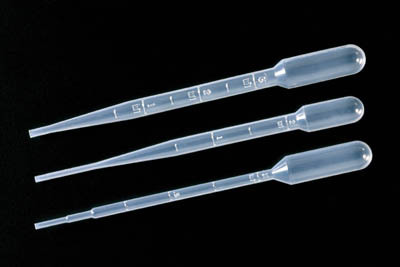 |
Pasteur pipette | Plastic pipette |
Pasteur pipette is made of glass. It has a long and thin end with almost even diameter. Volume of each drop drop from it does not vary much and can be regarded as the same. Plastic pipette is comparatively short. Dropping by hand pressure causes change of shape of the plastic pipette which results in uneven volume of drops and hence contribute to a source of experimental error.
Expt (19): 0.1M CH3COOH vs 0.1M NaOH (weak acid vs strong base) titration curve
(i) Objective
Using a calibrated antimony combination electrode pH meter and the “DMM Display Technique”, plot a weak acid vs strong base titration curve.
(ii) Reagent and equipment
|
Reagent |
Qty |
Equipment |
Qty |
| * 1M CuSO4 |
1 cm3 |
Sb/Cu,Cu2+combination pH electrode with connecting cable | 1 pair |
| * 0.1 M CH3COOH |
10 cm 3 |
pH sensor |
1 |
| * 0.1 M NaOH |
10 cm 3 |
Pasteur pipette |
5 |
| pH 7 buffer solution |
10 cm 3 |
Jumbo plastic pipette |
1 |
| Universal indicator |
1 cm 3 |
Micro-tip plastic pipette |
1 |
| Methyl orange indicator |
1 cm 3 |
24-well plate |
1 |
|
|
250 cm3 beaker with deionized water |
1 |
|
| DMM with cable |
1 |
||
| “salt-plug” |
3 |
||
| A small piece of sand paper |
1 |
||
| Access to a computer installed with the spreadsheet “Excel” software | — | ||
*
(iii) Experimental procedures
(a) Preparation of Sb/Cu, Cu2+ combination electrode and “One-point calibration”
Repeat Expt. (17) setups 1 – 6 for the preparation of the combination electrode. Use buffer solution pH = 7.00 for “One-point calibration”.
(b) pH titration curve
| 1. | Transfer, with the help of a clean Pasteur pipette, 25 drops of 0.1 M CH3COOH into a well of a 24-well plate, followed by a large drop of methyl orange indicator. |
| 2. | Connect the antimony combination pH electrode cable to the sensor input and the output to a DMM set at the DC 2000 mV full scale range. |
| 3. | Place the pH electrode into the well containing 25 drops of 0.1 M CH3COOH. |
| 4. | Stir the electrode for a couple of seconds, stop for another 30 seconds and record the pH value displayed by the DMM. |
| 5. | Fill the same cleansed Pasteur pipette with 0.1 M NaOH. Drop the content dropwise to the reaction well. Observe the change in display values and record each one of them sequentially. Observe also the accompanying colour change. |
| 6. | Continue titration in this manner until 40 drops of 0.1 M NaOH had been added. |
(iv) Result
|
Drops of |
pH |
Drops of |
pH |
|
0 |
2.3 |
21 |
4.8 |
|
1 |
2.7 |
|
|
|
2 |
2.9 |
23 |
5.2 |
|
3 |
3.1 |
24 |
5.7 |
|
|
|
25 |
9.5 |
|
5 |
3.4 |
26 |
11.0 |
|
|
|
27 |
11 .0 |
|
7 |
3.6 |
28 |
11.1 |
|
9 |
3.8 |
30 |
11.5 |
|
11 |
4.0 |
32 |
11.6 |
|
13 |
4.1 |
34 |
11.8 |
|
15 |
4.3 |
36 |
11.8 |
|
17 |
4.5 |
38 |
12.0 |
|
19 |
4.7 |
40 |
12.0 |
(v) Treatment of data
1. Activate the spreadsheet “Excel” software. Establish data columns of no. of drops and pH values.
2. From the main menu click “Insert” and choose the “Graph” icon.
3. Select the X-Y scattered diagram option
4. Streamline axes parameters and build a decent appearance of a pH titration curve.
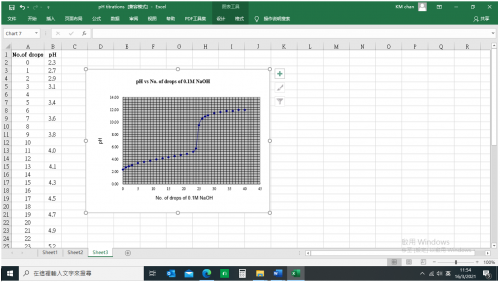
(vi) 0.1 M CH3COOH vs 0.1 M NaOH titration curve
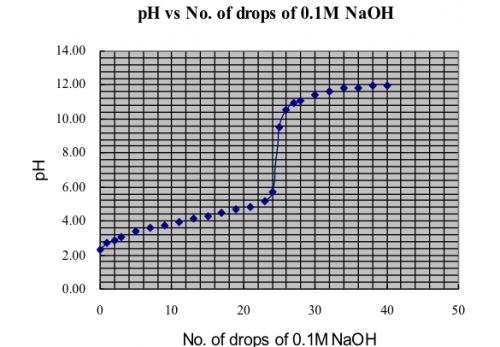
(vii) Question for discussion
Why should a Pasteur pipette and not a plastic pipette be used for the dropwise titration?
|
|
|
Pasteur pipette |
Plastic pipette |
Pasteur pipette is made of glass. It has a long and thin end with almost even diameter. Volume of each drop from it does not vary much and can be regarded as the same. Plastic pipette is comparatively short. Dropping by hand pressure causes change of shape of the plastic pipette which results in uneven volume of drops and hence contribute to a source of experimental error.
Expt (20): Basic method of antimony combination electrode for pH measurement without using sensor
(i) Objective
1. To perform a basic antimony pH electrode calibration
2. To plot (i) a strong acid vs strong base and (ii) weak acid vs strong base titration curve
(ii) Reagent and equipment
Reagent | Qty | Equipment | Qty |
| * 1M CuSO4 | 1 cm3 | Sb/Cu, Cu2+ combination electrode | 1 pair |
| * 1M HCl | 1 cm3 | Pasteur pipette | 1 |
| 0.1 M CH3COOH | 10 cm 3 | Jumbo plastic pipette | 5 |
| 0.1 M NaOH | 10 cm 3 | Micro-tip plastic pipette | 1 |
| Buffer solutions of pH 2,4, 7 10 and 13 | 10 cm 3 | 24-well plate | 1 |
| Universal indicator | 1 cm 3 | 250 cm3 beaker with deionized water | 1 |
| Phenolphthalein indicator | 1 cm 3 | DMM | 1 |
| “salt-plug” | 1 | ||
| Small piece of sand paper | 1 | ||
*
(iii) Experimental procedures
(A) Basic pH calibration and pH measurement by graphical method
1. With the help of a micro-tip pipette, fill the small chamber of the glass tubing of the reference electrode with 1 M CuSO4 solution until the solution overflows and exhibits a meniscus curvature (Fig. 227, 228) Close the opening by forcing a bit of “salt-bridge” (Fig. 229). No air bubbleis allowed inside the chamber, otherwise current conduction will be hindered and cause unstable signal. Figure 230 shows a finished set of the combination electrode.
(Fig. 227) | (Fig. 228) | (Fig. 229) | (Fig. 230) |
2. Separately place buffer solutions of pH 2, 4, 7 10 and 13 (i.e. 0.1M NaOH(aq)) into 5 wells of a 24-well plate. Each add 3 drops of universal indicator.
3. Connect the antimony combination electrode to the DMM. Antimony electrode is connected to the negative socket of the DMM while the copper/copper sulphate reference electrode to the positive socket. Switch on the pH sensor. The combination electrode is then placed in the pH 2 well. Stir a while to attain redox equilibrium and record the DMM reading (Fig. 231).
4. Clean the combination electrode with deionized water. Place it in the pH 4 well, stir and record DMM reading (Fig. 232).
5. Repeat step (4) with wells of pH 7, 10 and 13. Record respective readings (Fig. 233, 234 and 235).
(Fig. 231) | (Fig. 232) | (Fig. 233) |
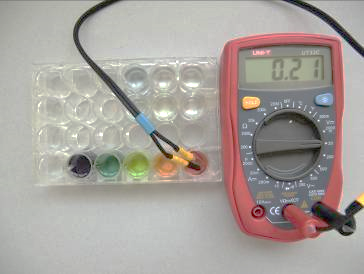
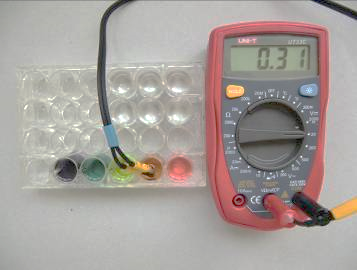
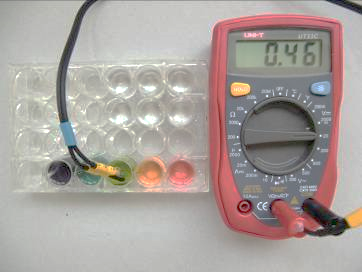
(Fig. 234) | (Fig. 235) |
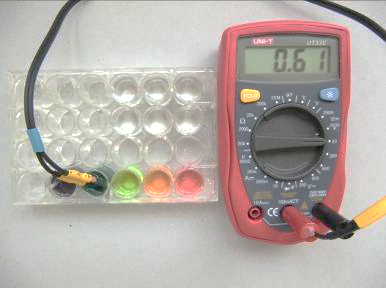
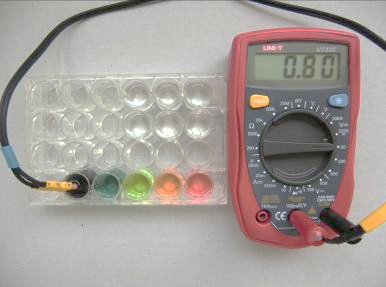
6. Activate the “Excel” spreadsheet
7. Click “Input” from the main menu
8. Input pH and raw e.m.f. values.
9. Select the “Graph” icon and the scattered diagram option
10. Obtain the related linear equation (trendline) which is expressed as e.m.f. = slope (pH) + intercept
11. Input conversion equation for pH: = PRODUCT(1/slope),SUM(e.m.f.,-intercept))
12. Input a value of e.m.f. under the Raw e.m.f. column, a corresponding pH value will appear in the pH column. For example, input raw e.m.f. = 0.66 V in cell B10 will immediately obtain a pH value of 10.7 in the A10 cell.
(v) Result
pH | 2 | 4 | 7 | 10 | 13 |
| Raw e.m.f. / V | 0.21 | 0.31 | 0.46 | 0.61 | 0.80 |
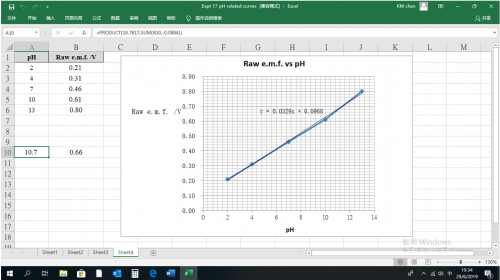
| Related linear equation: | y = 0.0529x + 0.0968 |
| Calibration equation: | e.m.f. = (0.0529) pH + 0.0968 |
pH values obtainable by the basic method without using sensor:
| (i) | Calculation from the calibration equation: if measured e.m.f. is 66 mV, then substitute this value of e.m.f. into the calibration equation, we have: 0.66 = (0.0529) pH + 0.0968 and obtain pH = 10.65 |
| (ii) | Making use of the “Excel” page: say input 0.66 V to a cell of the raw e.m.f. column, then the value of 10.7 will immediately appear in the pH column cell next to the value of 0.66. |
(B) (i) strong acid vs strong base and (ii) weak acid vs strong base titration curve
(i) 0.1 M HCl vs 0.1 M NaOH titration curve
Procedure
| 1. | Transfer, with the help of a clean Pasteur pipette, 25 drops of 0.1 M HCl into a well of a 24-well plate, followed by a large drop of phenolphthalein indicator |
| 2. | Connect the antimony combination pH electrode cable to the output to a DMM set at the DC 2000 mV full scale range. |
| 3. | Place the pH electrode into the well containing 25 drops of 0.1 M HCl. |
| 4. | Stir the electrode for a couple of seconds, stop for another 30 seconds and record the e.m.f. value displayed by the DMM. |
| 5. | Fill the same cleansed Pasteur pipette with 0.1 M NaOH. Drop the content dropwise to the reaction well. Observe the change in display values and record each one of them sequentially. Observe also for any accompanying colour change. |
| 6. | Continue titration in this manner until 40 drops of 0.1 M NaOH had been added. |
| 7. | Referring to the “Excel” page created by expt (A), convert the raw e.m.f. recorded to pH values. |
Result
Drops of 0.1 M NaOH | pH | Drops of 0.1 M NaOH | pH |
0 | 1.5 | 21 | 2.2 |
1 | 1.5 |
| |
2 | 1.5 | 23 | 2.3 |
3 | 1.5 | 24 | 2.7 |
| 25 | 3.3 | |
5 | 1.5 | 26 | 9.3 |
| 27 | 10.6 | |
7 | 1.6 | 28 | 10.9 |
9 | 1.6 | 30 | 11.3 |
11 | 1.6 | 32 | 11.3 |
13 | 1.8 | 34 | 11.5 |
15 | 1.8 | 36 | 11.5 |
17 | 1.8 | 38 | 11.6 |
19 | 2.0 | 40 | 11.6 |
Treatment of data
1. Activate the spreadsheet “Excel” software. Establish data columns of no. of drops and pH values.
2. From the main menu click “Insert” and choose the “Graph” icon.
3. Select the X-Y scattered diagram option
4. Streamline axes parameters and build a decent appearance of a pH titration curve.
0.1 M HCl vs 0.1 M NaOH titration curve
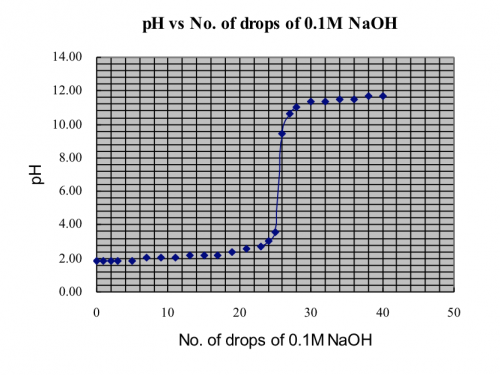
(ii) 0.1 M CH3COOH vs 0.1 M NaOH titration curve
Procedure
1. Repeat procedures of expt (ii) steps (1) to (7), using 0.1 M CH3COOH instead of 0.1 M HCl. Complete the following table:
| Drops of 0.1 M NaOH | pH | Drops of 0.1 M NaOH | pH |
0 | 2.3 | 21 | 4.9 |
1 | 2.7 |
| |
2 | 2.9 | 23 | 5.2 |
3 | 3.1 | 24 | 5.7 |
| 25 | 9.5 | |
5 | 3.4 | 26 | 10.6 |
| 27 | 10.9 | |
7 | 3.6 | 28 | 11.1 |
9 | 3.8 | 30 | 11.5 |
11 | 4.0 | 32 | 11.6 |
13 | 4.1 | 34 | 11.8 |
15 | 4.3 | 36 | 11.8 |
17 | 4.5 | 38 | 12.0 |
19 | 4.7 | 40 | 12.0 |
2. Activate the spreadsheet “Excel” software. Establish data columns of no. of drops and pH values.
3. From the main menu click “Insert” and choose the “Graph” icon.
4. Select the X-Y scattered diagram option
5. Streamline axes parameters and build a decent appearance of a pH titration curve.
0.1 M CH3COOH vs 0.1 M NaOH titration curve
Remark
Although the non-sensor method which depends on DMM display and software evaluation, can arrive at pH results with 2 decimal places or more, pH values corrected to 1 decimal place was adopted because accuracy of pH measurement by antimony electrode is not suffice such claim.7
Expt (21):Micro-scale investigation of conductance of electrolytes
(i) Objective
1. To identify electrolytic and non-electrolytic solutions
2. To identify strong or weak electrolytic solutions
3. Effect of dilution on conductivity w.r.t. (i) strong electrolytes and (ii) weak electrolytes
(ii)Introduction
Electrical conductance of aqueous solutions is due to presence of mobile ions. Ionic compounds are soluble in water and form mobile ions and hence conduct electricity. Covalent compounds with ionic character, like ethanoic acid, are also soluble in water and also conduct electricity. However, these compounds are weakly conducting. Covalent compounds with hydroxyl groups, like sugar or ethanol, are soluble in water but do not conduct electricity.
(iii) Safety
Wear safety spectacles and avoid skin contact with chemicals. Aqueous ammonia and glacial acetic acid have very irritating smell. Wear proper face masks. Contact doctors in advance for students sensitive to these gases. Use minimum amount of reagents. Dispose of chemical waste and excess materials properly. |
|
(iii) Reagent and equipment
Reagent | Qty | Equipment | Qty |
| ** Glacial (100%) ethanoic acid | 50 cm 3 | Micro-scale conductivity probe | 1 |
| * 1 M H2SO4 | 100 cm 3 | Conductivity sensor | 1 |
| * 1 M CH3COOH | 100 cm 3 | Pasteur pipette | 5 |
| 1 M NaCl | 100 cm 3 | Medical mask | 1 |
| * 1M NH3(aq) | 100cm 3 | Organic combo well plate | 1 |
| Sat. NaCl (aq) | 100 cm 3 | 100 cm3 beaker | 5 |
| 20% Glucose solution | 10 cm 3 | DMM | 1 |
| 95% C2H5OH | 10 cm 3 | Mini magnetic stirrer | 1 |
| Deionized water | Suitable amount | A small piece of sand paper | 1 |
* **
(iv) Experimental procedures and results
a. Identification of electrolytic and non electrolytic solutions
1. Label the small wells of the organic combo well plate as 1 – 8 (organic well plate has 6 x 2 big wells and 12 x 3 small wells). Place drops of each of the following solutions using a clean Pasteur pipette according the following table:
(Table 1)
Small well label | 1 | 2 | 3 | 4 | 5 | 6 | 7 | 8 |
Solution | 10 drops of deionized water | 10 drops of 20% glucose solution | 10 drops of 95% ethanol | 10 drops of 1M ethanoic acid | 10 drops of 1M sulphuric acid | 10 drops of 1M sodium hydroxide | 10 drops of 1M ammonia | 10 drops of 1M sodium chloride |
2. Connect the DMM (set at the DC 2000 mV range), the sensor and the mini conductivity probe. Switch on the setup and short circuit the two ends of the probe by a piece of metallic wire (Fig. 236). First turn the knob so that the DMM displays 100 mV, allow 30 seconds for electrical equilibrium. In this way the sensor is calibrated and set to a full scale of 100. Second, continue to turn the knob to display 200 mV for a full-scale calibration set at 200. Thirdly, a 300 full scale calibration (Fig. 237) can be done similarly. Full scale calibration set at 200 or 300 enhances sensitivity of conductivity measurement.
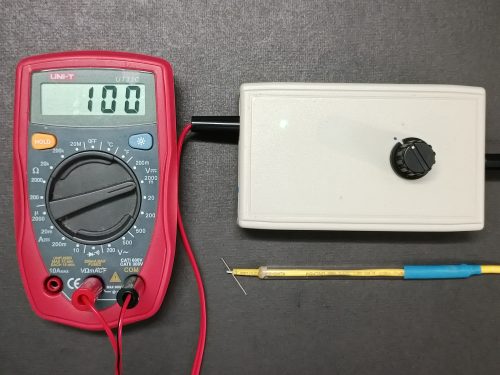 | |
(Fig. 236) 100 mV ”short circuit calibration” | (Fig. 237) 300 mV ”short circuit calibration” |
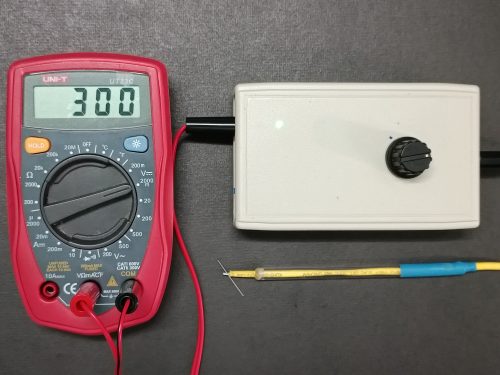
3. For the case of 100 full scale calibration: Place the probe into well 1, stir a while and rest it at the bottom of the well. Record the steady DMM reading.
4. Rinse the probe with deionized water. Place it into well 2, stir a while and rest it at the bottom of the well. Record the steady DMM reading.
5. Repeat step (4) with wells 3, 4, 5, 6, 7 and 8.
6. Repeat steps (3) to (5) with setup calibrated at 300 full scale calibration.
7. Complete Table (2):
Well | 1 | 2 | 3 | 4 | 5 | 6 | 7 | 8 | |
Solution | 10 drops of deionized water | 10 drops of 20% glucose solution | 10 drops of 95% ethanol | 10 drops of 1M ethanoic acid | 10 drops of 1M sulphuric acid | 10 drops of 1M sodium hydroxide | 10 drops of 1M ammonia | 10 drops of 1M sodium chloride | |
DMM | 300 | 2 | 2 | 2 | 15 | 243 | 222 | 14 | 184 |
100 | 1 | 1 | 1 | 5 | 81 | 74 | 5 | 61 | |
B. Identification of weak, strong and non electrolytic solutions
Given the solutions investigated for their relative conductivities, complete Table (3):
| Non-electrolyte | Weak electrolyte | Strong electrolyte |
Solution |
|
|
|
C. Effect of dilution on conductivity w.r.t. (i) strong electrolytes and (ii) weak electrolytes
Base on results of Table (2) and the chemicals under experimentation, investigate the effect of dilution on conductivity w.r.t.: (i) sat. NaCl,(ii) 1 M NaCl, (iii) 100% CH3COOH and (iv) 1 M CH3COOH。
First label the wells of the organic combo well plate in terms a horizontal and vertical matrix with numeral and alphabetical axes against a sheet of white paper for investigation purpose (Fig. 235).
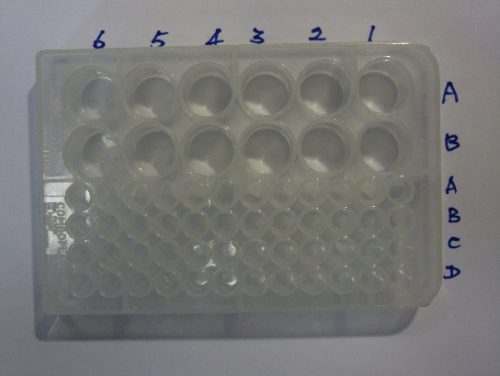
(Fig. 238) Matrix labelling of organic combo well plate
(i) Sat. NaCl solution
1. Prepare a 100 cm3 beaker half filled with sat. NaCl solution and 4 other beakers each filled with half the amount of deionized water (one for transfer and the other three for cleansing).
2. This part of the experiment uses big wells of the combo well plate. This is because the small wells are too small for stirring by the probe. Switch on the sensor and choose the 300 full scale mode.
3. With the help of a clean Pasteur pipette, transfer 40 drops of sat. NaCl solution into A/1 well. 35 drops into A/2 well, 30 drops into A/3 well, 25 drops into A/4 well, 20 drops into A/5 well, 15 drops into A/6 well, 10 drops into B/6 well and 5 drops into B/5 well.
4. By using the same clean Pasteur pipette, transfer 5 drops of deionized water into A/2 well. 10 drops into A/3 well, 15 drops into A/4 well, 20 drops into A/5 well, 25 drops into A/6 well, 30 drops into B/6 well and 35 drops into B/5 well.
5. The dilution method adopted was called the “continuous variation method”. It features maintaining total volume of solution unchanged while vary the amount of reagent added in a sequential ratio of 7: 6: 5: 4: 3 : 2: 1. Thus, the final concentration decreases linearly in the ratio of![]() . If the total volume does not maintain unchanged, then the actual concentration has to be calculated after each addition of reagent.
. If the total volume does not maintain unchanged, then the actual concentration has to be calculated after each addition of reagent.
6. Dip the probe into well A/1, stir for a while. Stop and let it rest at the bottom of the well. Wait for a steady DMM ready and record its value. Clean the probe by rinsing in deionized water 3 times and get ready for the experiment.
7. Repeat setup (6) for conductivities of wells A/2, A/3, A/4, A/5, A/6, B/6 and B/5.
8. Switch to the set to the 100 full-scale calibration mode. Repeat steps (1) to (7) and record respective conductivity values.
9. Complete Table (4):
Well | A/1 | A/2 | A/3 | A/4 | A/5 | A/6 | B/6 | B/5 | |
Solution | Drops of sat. NaCl | 40 | 35 | 30 | 25 | 20 | 15 | 10 | 5 |
Drops of deionized water | 0 | 5 | 10 | 15 | 20 | 25 | 30 | 35 | |
DMM | 300 FS | 185 | 190 | 188 | 186 | 182 | 179 | 169 | 146 |
100 FS | 62 | 63 | 63 | 62 | 61 | 60 | 56 | 49 | |
(ii) 1 M NaCl solution
Repeat all steps of experiment (i) on sat. NaCl, replacing sat. NaCl by 1 M NaCl solution.
Complete Table (5):
Well | A/1 | A/2 | A/3 | A/4 | A/5 | A/6 | B/6 | B/5 | |
Solution | Drops of | 40 | 35 | 30 | 25 | 20 | 15 | 10 | 5 |
Drops of | 0 | 5 | 10 | 15 | 20 | 25 | 30 | 35 | |
DMM | 300 FS | 157 | 149 | 142 | 135 | 128 | 116 | 92 | 73 |
100 FS | 52 | 50 | 47 | 45 | 43 | 39 | 31 | 24 | |
(iii) 100% CH3COOH
Caution:100% CH3COOH has intense irritating smell. Must wear protective medical mask. Students with asthma medical record should not be allowed to perform the experiment. Experiment (iii) is dealing with a covalent compound and low conductivity is expected. Hence, the setup should employ the 300 full scale mode.
Complete Table (6):
Well | A/1 | A/2 | A/3 | A/4 | A/5 | A/6 | B/6 | B/5 | |
Solution | Drops of 100% CH3COOH | 40 | 35 | 30 | 25 | 20 | 15 | 10 | 5 |
Drops of deionized water | 0 | 5 | 10 | 15 | 20 | 25 | 30 | 35 | |
DMM | 300 FS | 2 | 2 | 10 | 14 | 21 | 22 | 22 | 18 |
(iv) 1 M CH3COOH solution
Repeat all steps of experiment (iii) on 100% CH3COOH, replacing 100% CH3COOH by 1 M CH3COOH. 1M CH3COOH has vinegar smell, wearing medical mask is still recommended. Experiment (iv) involves a covalent compound, the setup should also employ the 300 full scale mode.
Complete Table (7):
Well | A/1 | A/2 | A/3 | A/4 | A/5 | A/6 | B/6 | B/5 | |
Solution | Drops of 1 M CH3COOH | 40 | 35 | 30 | 25 | 20 | 15 | 10 | 5 |
Drops of deionized water | 0 | 5 | 10 | 15 | 20 | 25 | 30 | 35 | |
DMM | 300 FS | 18 | 17 | 16 | 15 | 14 | 12 | 9 | 8 |
(v) Plot of results
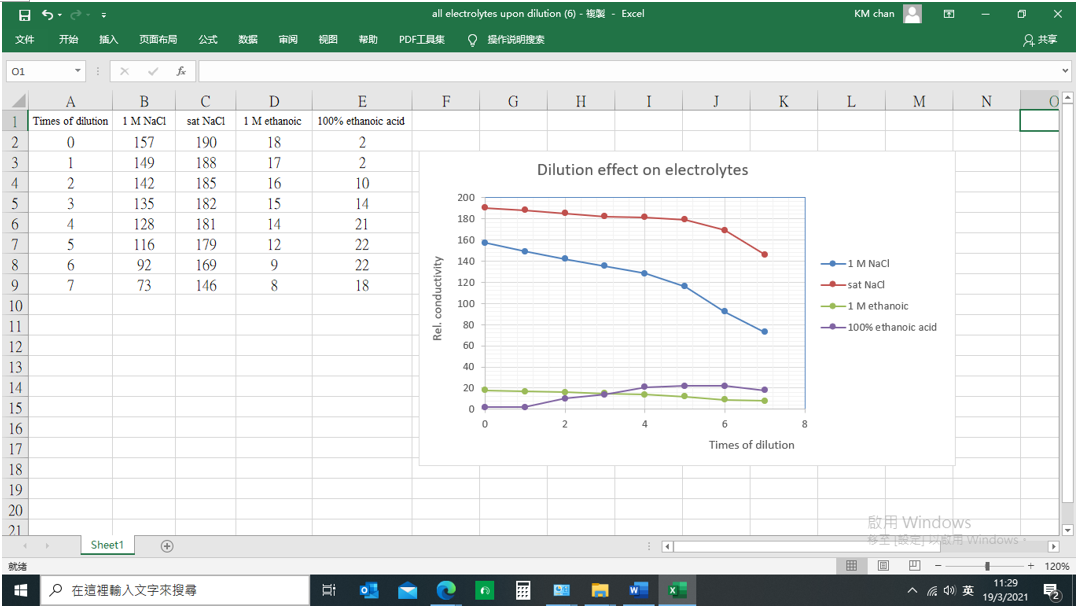
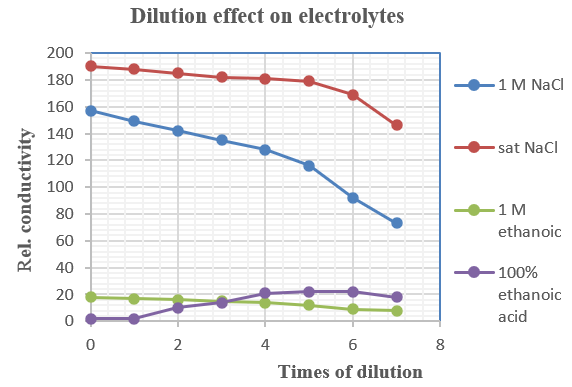
Tabulated data collected from experiments (i) to (iv) can be represented graphically. Activate the spreadsheet “Excel” software. Establish data columns of Times of dilution, 1M NaCl, sat. NaCl, 1 M ethanoic acid and 100% ethanoic acid. From the main menue click “Insert” and choose the “Graph” icon. Select the X-Y scattered diagram option. Streamline axes parameters and build a decent appearance of a conductometric titration curve.
(vi) Conclusion
Electrolytes ionize in water. For example, sodium chloride, sulphuric acid, ethanoic acid, ammonia etc.
1. Non electrolytes are non-ionizable. For example, deionized water, glucose, ethanol etc.
2. Under the same condition, aqueous solutions of strong electrolytes conduct electricity better than the weak counterparts.
3. Under normal conditions, dilution causes conductivity to decrease. However, some soluble non electrolytic chemicals, like 100% ethanoic acid, their solution conductivity increases with dilution within a certain range of concentration. This is because they ionize in water to form mobile ions (Table 6).
4. Presence of Mobile ionscause electrical conductance.
(vii) Discussion
1. List two factors determining whether a solution is electrically conducting or not.
Presence of ions and AC/DC current
2. What is the static state of these two factors?
In mobile state
3. Solid state electrical conductance is due to free electrons while that of aqueous solution is due to mobile ions. List TWO important industrial processes based on this fact.
Electric motors and electrolysis
(viii) Internet search
1. Connect to the internet and find out a reasonable explanation for electrical conductivity of aqueous solution is not due to streams of mobile electrons.
Website | |
Information /explanation | Essential ideas 1. Conduction of DC current in electrolytic solution is by mobile ions with decomposition of electrolytes and discharge of ions. 2. Conduction of AC current in electrolytic solution dos not involve mobile ions with decomposition of electrolytes nor discharge of ions. 3. AC current functions like a “push-pull” mechanism for transferring electrons through ions of opposite charges in aquous solutions by alternating electrode polarities. (+) and (–) ions of the electrolyte are vibrating, but remain stationary, under the influence of the electric field. As electrons leaves (pushed) the electrode in the positive cycles, electrons are accepted (pulled) by the other electrode in the negative cycle. The net effect is transfer of electrons, through the vibrating (+) and (-) ions, from one electrode to the other. 4. Formation of hydrated electron in aqueous solution is impossible and hence conduction by mobile electrons. |
2. Find out the difference between concentration and “effective concentration” or called as “activity”, a.
Activity (a) is a measure of the effective concentration of a species under non-ideal (e.g., concentrated) condition. It is acceptable to use concentration for diluted solutions, but when you are dealing with more concentrated solutions, the situation becomes less free and congested and only a fraction of the total ions, or the “effective concentration” can perform according to stoichiometric requirements. This is the reason for proposing activity instead of concentration.
We have become accustomed to using the equation pH = − log[H+], but this equation is not accurate, as the effective concentration of H+ ions are actually measured, not the stoichiometrically calculated concentration. A better expression for pH is ![]()
Activity concept involves advanced thermodynamic parameters such as chemical potential, ionic strength, Gibbs free energy which in short are dealing with realistic entities of non-ideal environments.
Expt (22): Conductometric titration
(i) Objective
1. To perform a micro-scale acid/base conductometric titration
2. To calculate a value of concentration of a sample solution of sulphuric acid by conductometric titration against a standard 0.01 M Ba(OH)2 solution
(ii) Introduction
Conductometric titration is one of the techniques in volumetric analyses of concentration determination. Covalent water molecule is one of the reaction products. Presence of water molecule causes electrical conductivity to decrease. Assuming reaction goes to completion, when all reactants are stoichiometrically consumed and no more water molecule appears, further addition of one of the ionic reactants (the titrant) will result in increase of conductivity. Hence, the titration curve will have a fall and then rise. The point of inflection is called the “equivalence point”, or commonly called as the “end point”. It represents the titrant has stoichiometrically reacted with the other reactant. If the concentration of the reactant in the conical flask or beaker is known, then the concentration of the titrant in the burette can be calculated.
One point to note: Dilution leads to decrease of electrical conductance. Titrant from the burette not only react with the reactant in the flask, it also increases the total volume of the product solution and dilutes its concentration. Because of this reason, the initial volume of solution in the flask should not differ much from the final volume. A common rule is to make the ratio of concentration of the titrant to the reactant to be titrated in a 10:1 ratio, so that there is only a slight change of volume. However, there is one condition to be met: the stoichiometric coefficient of the two reactants should be 1:1.
(iii) Safety
Wear safety spectacles and avoid skin contact with chemicals. Use minimum amount of reagents. Dispose of chemical waste and excess materials properly. |
|
(iv) Reagent and equipment
Reagent | Qty | Equipment | Qty |
* ~ 1 M H2SO4 | 100 cm 3 | Micro conductance probe | 1 |
* 0.01 M Ba (OH)2 | 100 cm 3 | Conductivity sensor | 1 |
Phenolphthalein | 5 cm3 | 10 cm3 pipette | 1 |
Deionized water | Suitable amount | 50 cm3 burette | 1 |
| 150 cm3 conical flask | 2 | |
24-well plate or | 1 | ||
Pasteur pipette | 2 | ||
100 cm3 beaker | 5 | ||
DMM | 1 | ||
100 cm3 volumetric flask | 1 | ||
Micro-tip plastic pipette | 1 | ||
Glass rod stirrer | 1 | ||
A small piece of sand paper | 1 | ||
*
(iv) Experimental procedures
1. Prepare 3 clean 100 cm3 beaker, each halfly filled with deionized water, for rinsing purpose.
2. Transfer, with the help of a 10 cm3 pipette, 10 cm3 of the sample ~ 1 M H2SO4 into a 100 cm3 volumetric flask, add deionized water to the graduated mark, mix well to form 100 cm3 ~ 0.1M H2SO4. Pour some into a clean 100 cm3 beaker.
3. Prepare a clean combo well plate or a 24-well plate and transfer, by using a Pasteur pipette, 50 drops of standard 0.01M Ba(OH)2(aq) into one of the big wells, followed by 2 drops of phenolphthalein indicator.
4. Plug in the micro-scale conductance probe and switch on the sensor. Connect it to the DMM selected at the DC 2000 mV range. Short circuit the two ends of the probe with a metal wire. Turn the knob of the sensor until the DMM display 200 mV. The position of the knob is fixed. Having done this, the setup has calibrated in a 200 full scale mode (Fig. 239).
5. Place the probe into the well, stir for a while. Stop and let it rest at the bottom of the well (Fig. 240). Repeat the action until a steady DMM reading is achieved and record the reading in Table (1). Ensure electrolysis does not occur (Fig. 241).
6. Use a clean Pasteur pipette and carefully add one drop of ~ 0.1 M H2SO4 to the well. Stir the probe for a while, rest it at the bottom of the well. Repeat the action until a steady DMM reading is achieved and record the reading (Fig. 242).
7. Transfer another drop of ~ 0.1 M H2SO4, repeat step (6).
8. Repeat steps of the experiment until 10 drops of ~ 0.1 M H2SO4 had been added. Watch out for the sudden colour change near the “equivalence point”.
9. Complete Table (1):
Drops of ~ 0.1M H2SO4 | 0 | 1 | 2 | 3 | 4 | 5 | 6 | 7 | 8 | 9 | 10 |
Rel. conductivity | 27 | 24 | 20 | 16 | 12 | 9 | 20 | 28 | 35 | 40 | 45 |
Ba(OH)2(aq) + H2SO4(aq) –> BaSO4(s) + 2H2O(l)
At the equivalence point, content of the well changed from _________ to ________________
(Fig. 239) 200 mV “short-circuit calibration” | (Fig. 240) The tip of the probe is placed at the bottom of the well |
(Fig.241) Absence of electrolysis during titration | (Fig. 242) Titration in process, DMM displaying a rel. conductance of 34% |
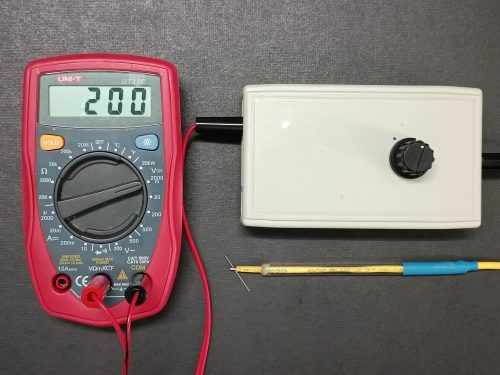
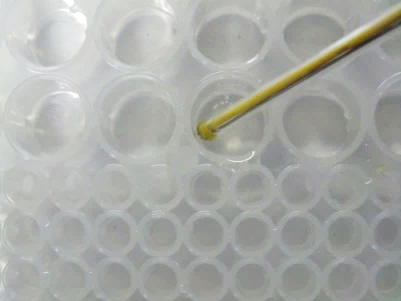
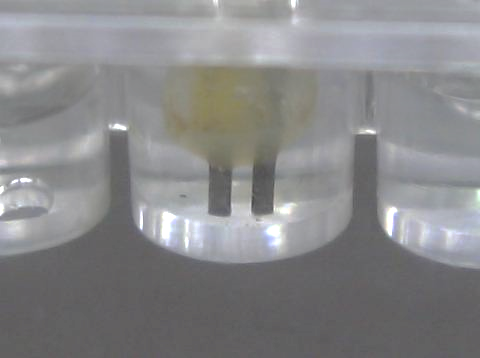
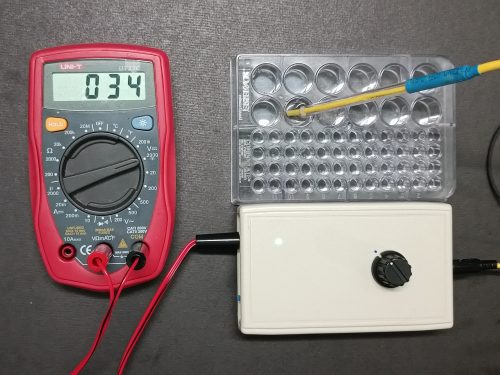
(v) Result
Activate the spreadsheet “Excel” software. Establish data columns of Rel. conduct-ance and number of drops of ~ 0.1 M H2SO4. From the main menue click “Insert” and choose the “Graph” icon. Select the X-Y scattered diagram option. Streamline axes parameters and build a decent appearance of a conductometric titration curve.
(vi) Conductometric titration curve
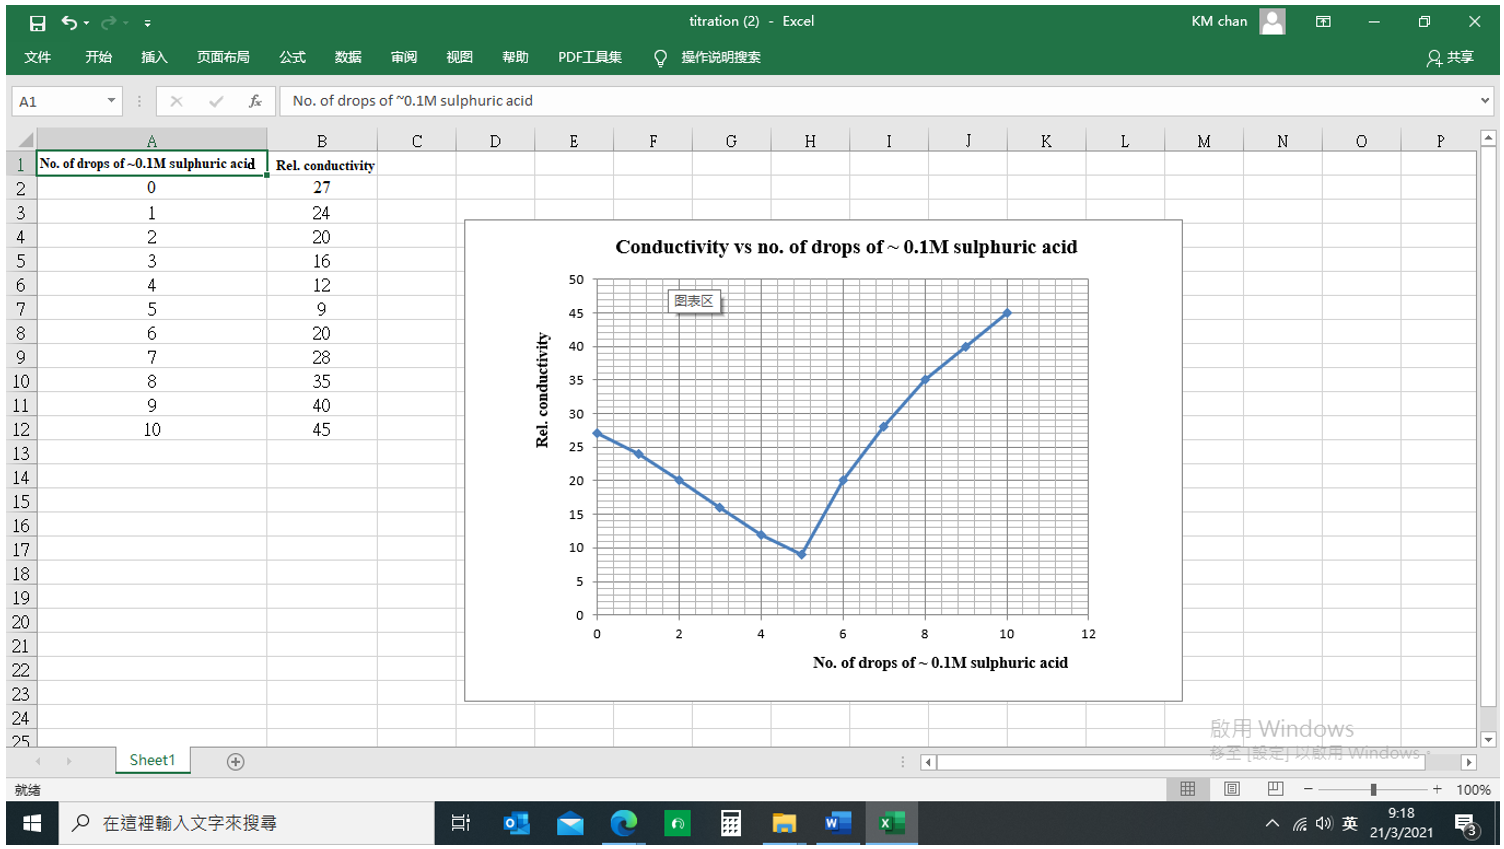
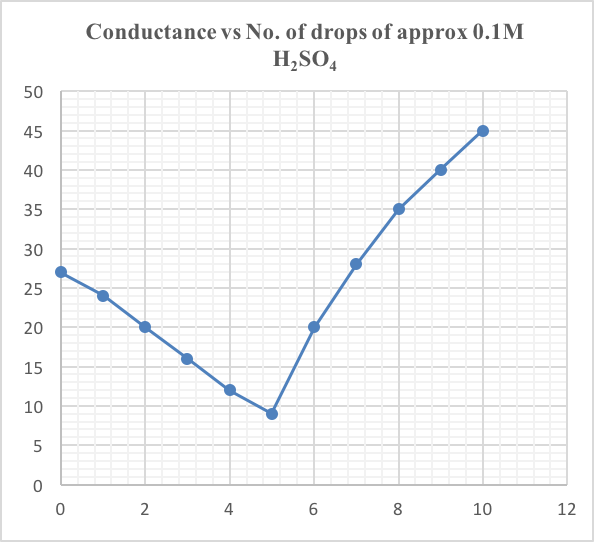
By inspecting the above graph, equivalence point occured at 5 drops of ~ 0.1 M H2SO4.
(vii) Calculation
According to stoichiometric calculation of the reacting equation, one mol of alkalis neutralizes one mol of acid. Let x cm3 = volume of one drop, c mol dm-3 = concentration of the diluted sulphuric acid. Value of c is calculated as follows:
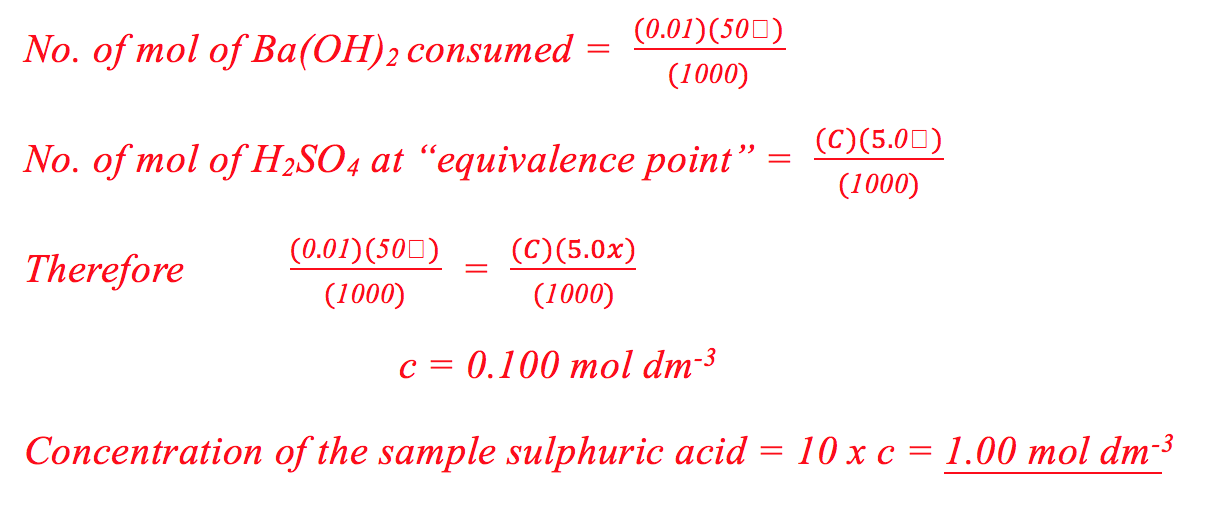
(viii) Discussion
1. Explain why a white precipitate was formed at the start of titration.
Well’s Ba(OH)2 and the added suphuric acid reacted together to form the insoluble BaSO4 which is a white precipitate.
Ba2+(aq) + SO42-(aq) –> BaSO4(s)
2. Briefly explain why the graph is steeper after the equivalence point.
In the 200 mV FSD calibration mode, the relative conductivity of 0.01 M Ba(OH)2 is 27 and that of 0 .01 M H2SO4 is 58. H2SO4(aq)is more conducting than Ba(OH)2(aq). At the start, only Ba2+(aq) and OH-(aq) ions are responsible for conductivity.Each drop of sulphuric acid added was all converted to the non conducting BaSO4(s)and H2O(l). Hence the Ba2+(aq) and OH-(aq) ions in the well became less and less. At the equivalence point, there were essentially no Ba(OH)2 (only ionized ions from BaSO4 and H2O). Further addition of titrant resulted in a sharp increase of conductivity due to the presence of highly ionized H2SO4(aq).
3. Briefly explain why curves instead of straight lines appeared in the graph.
Referring to page 60 (Fig. 145 and 146), electric field established by parallel rod electrodes are curved and not linear. When concentration of aqueous ions changes, conductivity varies non-linearly and not proportionally as its counter-part of concentric plates. Also, after the equivalence point, dilution effect became obvious.
4. What is the accuracy limitation for volumetric analysis? What other methods can be employed for determining trace amount of solute in aqueous solutions?
Method of titration can be as accurate as 10-4 mol dm-3. Coulometry can detect up to 10-5 mol dm-3. Concentration determination ranging from 10-6 to 10-8 mol dm-3 can use advanced instruments like Atomic Absorption Spectrometer.
5. Comparing with the traditional titration method using burette and conical flask, list two advantages in using the micro-scale conductometric method.
(i) Much less reactants needed and
(ii) whole number of drops (by counting) instead of actual volume with at least one decimal place (by measurement).
6. Suggest two main sources of instrumental error and ways to minimize them.
Instrumental error | Ways to overcome |
(i) Volume of each drop may not | Hold the Pasteur pipette at a fixed angle with the horizontal and apply even pressure. |
(ii) Equivalence point may be over-shot | Determination of equivalence point should be done by plotting a titration cuve and not just by counting number of drops. |
(ix) Conclusion
Concentration of a given sample of sulphuric acid had been determined to be 1.00 mol dm-3 by the method of micro-scale conductometric titration.
Expt (23):Determination of concentration of a sample of KMnO4 solution
(i) Objective
1. To determine concentration of a sample of KMnO4 solution by eye inspection
2. Use a colorimeter to determine concentration of a sample KMnO4 solution
(ii) Introduction
A. A pair of human eyes is a natural colorimeter
Human eyes can differentiate distance and 3D shape of objects (sensitive to phase difference of reflected waves) as well as colour and brightness (sensitive to wave length and amplitude of reflected waves). As such, our eyes are a kind of natural colorimeter. Consider an array of test tubes labelled 1, 2, 3…. to 10. Each one of them contains a known concentration, in sequential decreasing order, of a colour solution acting like a display board. If we bring a test tube containing the same colour solution but of unknown concentration, say X, near to this display board, and find out that its colour intensity is close to that of test tube 4, then we can say with some confidence that the concentration of X is the same as that of test tube 4. This method of estimation of concentration is called eye inspection.
Of course, the method has a lot of drawbacks. Even so, it still represents the basic principle of colorimetry. Accurate quantitative determination of colour intensity needs a colorimeter.
B. Determination of concentration of colour solution by colorimetry
A way to improve method (A) is by using quantitative approach involving data collection. A colorimeter is the instrument for this purpose. Like most quantitative instruments, colorimeter has to be calibrated first before starting measurement.
The traditional way of calibration is to use a calibration graph. Colour solutions do not emit light. Light intensity measurement by colorimeter is in fact measuring transmitted light (revise Topic 5.3). Transmitted ray vs solution concentration calibration graph is plotted. It is not a straight line (Fig. 243). Base on the calibration graph, concentration of an unknown colour solution (X) can be deduced by measuring the intensity of the transmitted light.
(Fig. 239) Titration in process, DMM displaying a rel. conductance of 34%
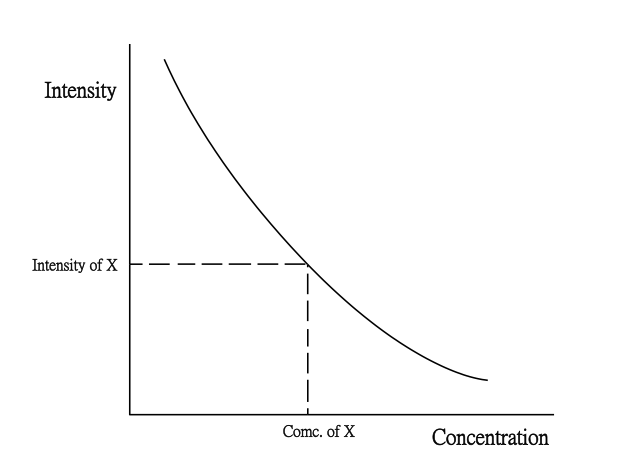
(Fig. 243) Calibration curve of a colorimeter
(iii) Safety
Wear safety spectacles and avoid skin contact with chemicals. Use minimum amount of reagents. Dispose of chemical waste and excess materials properly. |
|
(iv) Reagent and equipment
Reagent | Qty | Equipment | Qty |
4 x 10⁻³M KMnO4 | 25 cm3 | Homemade colorimeter with cables | 1 |
Solution X | 15 cm3 | DMM | 1 |
Deionized water | Suitable amount | Jumbo plastic pipette | 4 |
10 cm3 pipette | 2 | ||
Test tube | 10 | ||
250 cm3 beaker | 1 | ||
Glass rod stirrer | 1 | ||
Wash bottle with deionized water | 1 | ||
Tweezer | 1 pair | ||
(v) Experimental procedures
(A) Eye inspection to estimate the concentration of a sample of KMnO4 solution
1. Transfer, with the help of a 10 cm3 pipette, 20 cm3 4 x 10⁻³ M KMnO4 into test tube (1). From test tube (1) transfer 10 cm3 of the solution to test tube (2), add an equal volume of deionized water and stir well.
2. Transfer 10 cm3 of solution in test tube (2) to test tube (3), add an equal volume of deionized water and stir well.
3. Transfer 10 cm3 of solution in test tube (3) to test tube (4), add an equal volume of deionized water and stir well.
4. Repeat step (3) four times and prepare test tubes (5), (6), (7) and (8). The following table lists the prepared concentrations.
Test tube | Concentration of KMnO4(aq) / x 10-4mol dm-3 |
1 | 40.00 |
2 | 20.00 |
3 | 10.00 |
4 | 5.00 |
5 | 2.5 |
6 | 1.25 |
7 | 0.625 |
8 | 0.3125 |
5. Arrange the 8 test tubes in a roll, hold them together vertically by using clear adhesive tape to from an alignment board (Fig. 244). Place test tube X containing the sample solution near the alignment board, decide which test tube of the alignment board matches X. Concentration of the sample is then assumed to be the same that of the test tube of the alignment board.
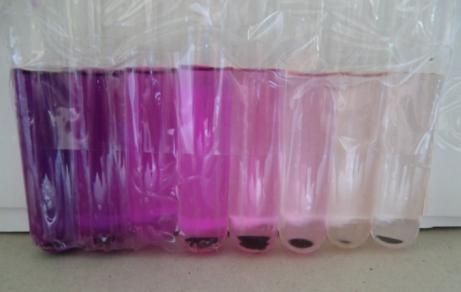
(Fig. 244) Test tube alignment board
(B) Determination of concentration of a sample of KMnO4 solution by a homemade colorimeter
(i) 100% blank transmittance calibration
1. | Connect the colorimeter to the DMM which is set at the DC 2000 mV range. |
2. | Switch on the colorimeter and select the green LED light source (520 nm). |
3. | Fill the cuvette 3/4 foll with deionized water. |
4. | With the help of a tweezer, lower the cuvette completely into the bottom part of the cuvette cavity compartment. Note that the two opposite clear and transparent sides of the cuvette shoold face respectively the light source and the LDR. Cover the cavity opening with a lid. |
5. | Adjust the knob so that the DMM displays 100 mV. Fix the position of the knob. Calibration for the green LED light source is completed and the instrument is ready for measurement. |
(ii) Concentration determination
1. | Using a Jumbo plastic pipette, transfer 40 drops of solution in test tube (1) to a clean cuvette. Wipe the two opposite clear sides with a piece of tissue paper, lower it completely to bottom apart of the cavity compartment and cover with the lid. Record the steady reading |
2. | Remove the cuvette with a pair of tweezers, empty the cuvette and clean it thoroughly. Next, transfer 40 drops of solution in test tube (2) to the cuvette. Wipe the two opposite clear sides with a piece of tissue paper, lower it completely to bottom apart of the cavity compartment and cover with the lid. Record the steady reading. |
3. | Repeat step (2) five times to finish test tubes (4), (5), (6), (7) and (8). |
(iii) Results (calibration curve)
Test tube | Conc. of KMnO4/ x 10-4mol dm-3 | DMM display (100 mV blank calibration) |
1 | 40.00 | 4.7 |
2 | 20.00 | 9.5 |
3 | 10.00 | 17.4 |
4 | 5.00 | 39.5 |
5 | 2.5 | 68.1 |
6 | 1.25 | 85.3 |
7 | 0.625 | 93.1 |
8 | 0.3125 | 96.4 |
(Fig. 245) Calibration data
DMM reading of solution X = _______________
(iv) Treatment of data
Activate the spreadsheet “Excel” software. Establish data columns of Transmittance and Concentration. From the main menue click “Insert” and choose the “Graph” icon. Select the X-Y scattered diagram option. Streamline axes parameters and build a decent appearance of a calibration curve.
(v) Calibration curve
![]()
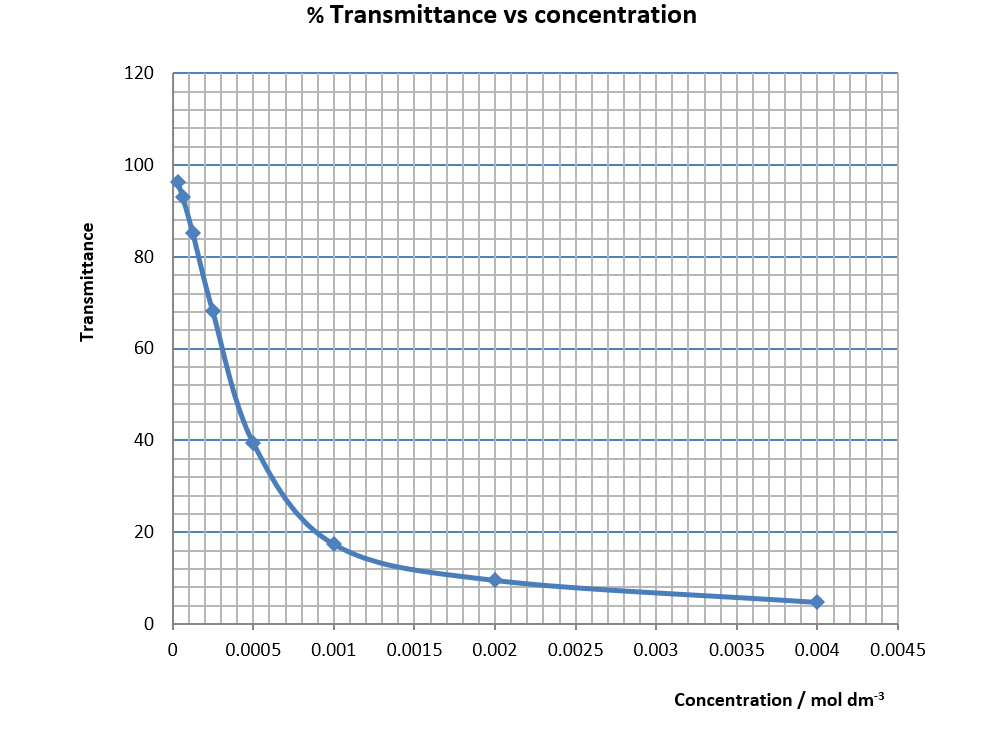
(Fig. 246) Calibration curve
According to the calibration curve, when DMM displays ______ mV, concentration of KMnO4 solution (X) is __________ mol dm-3
(vi) Discussion
1. Compared with instrumental method, is the method of eye inspection scientific?
In the absence of suitable instruments, eye inspection is actually a “trial-and-error” scientific method.
2. Apart from using colorimeter, propose another instrumental method to determine concentration of a colour solution. How accurate is it?
3. The following topic is about Beer’s law:
(a) Can we calculate instead of using a graph?
Yes
(b) How to calculate?
Need to establish an equation between concentration and transmittance.
(c) How to obtain such equation? Is concentration and transmittance linearly dependent or concern with other mathematical functions?
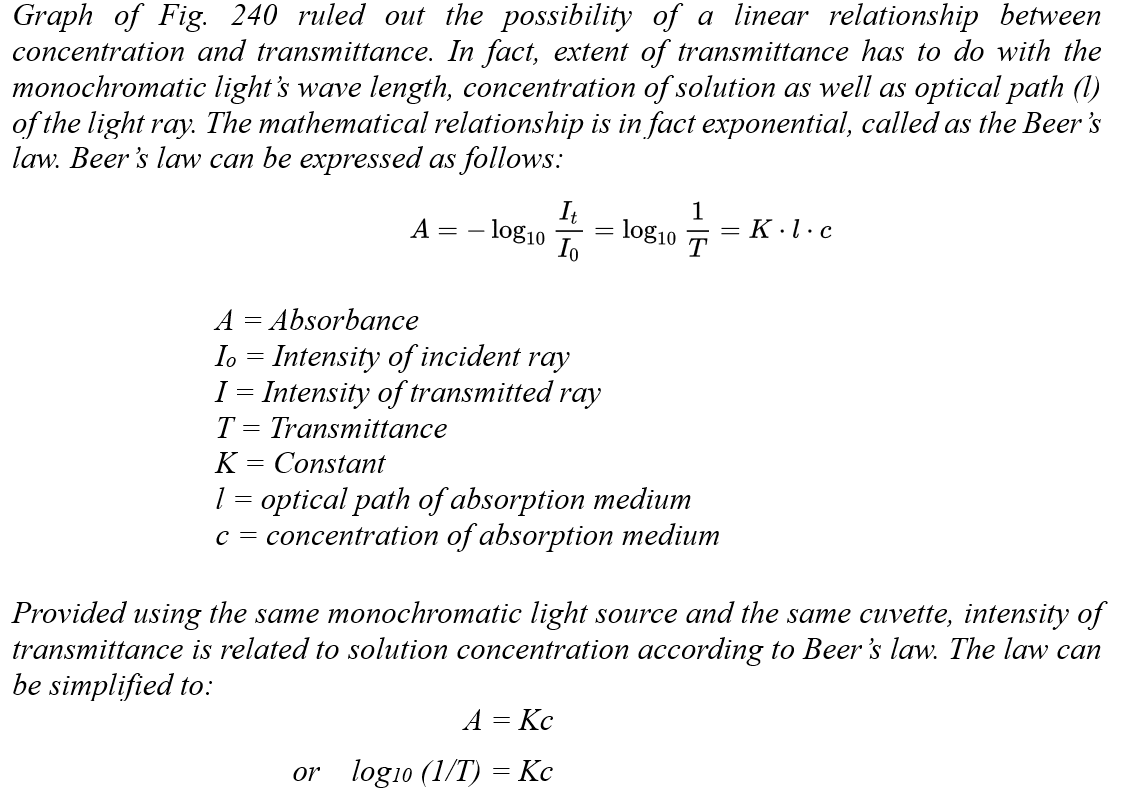
(d) Draw a graph of absorbance vs concentration. Confirm that it is a straight line graph. Deduce unknown concentrations by substituting values of absorbances.
Beer’s law does not hold for concentrated solutions. Hence, we have to ignore data of test tubes 2 and 2 from the table in Fig. 242. The revised table looks as follows:
Test tube | Conc. of KMnO4/ x 10-4 mol dm-3 | DMM display (100 mV calibration) |
3 | 10.00 | 17.4 |
4 | 5.00 | 39.5 |
5 | 2.5 | 68.1 |
6 | 1.25 | 85.3 |
7 | 0.625 | 93.1 |
Tabulated data for absorbance and concentration:
Test tube | Conc. of KMnO4 | DMM display | T (Transmittance) | 1/T | Absorbance |
3 | 10.00 | 17.4 | 0.174 | 5.75 | 0.76 |
4 | 5.00 | 39.5 | 0.395 | 2.53 | 0.40 |
5 | 2.5 | 68.1 | 0.681 | 1.47 | 0.17 |
6 | 1.25 | 85.3 | 0.853 | 1.17 | 0.07 |
7 | 0.625 | 93.1 | 0.931 | 1.07 | 0.03 |
Activate the “Excel” spreadsheet. Input concentration and absorbance data and plot the XY scattered graph.
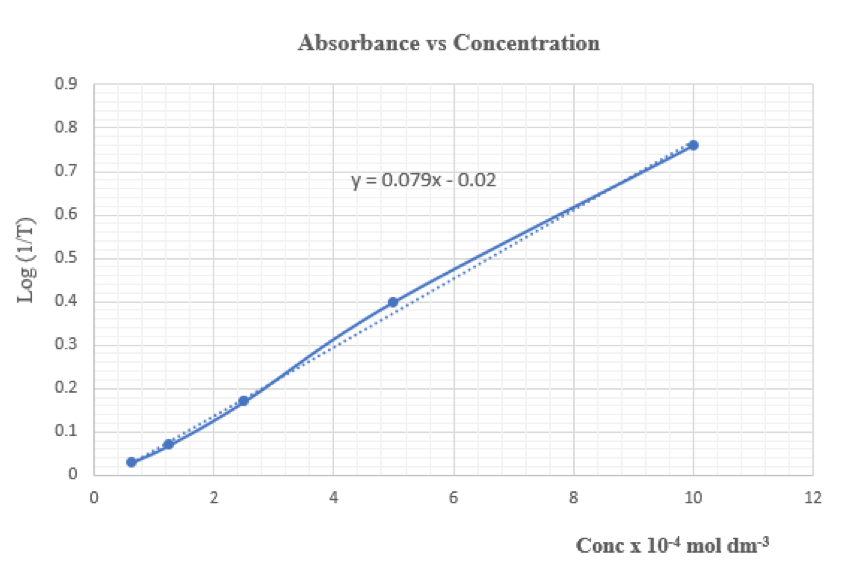
Linear equation: Absorbance = 0.079 (Conc x 104 mol dm-3) – 0.02
Concentrations can be calcolated by substituting values of absorbance into the above equation. As “DMM Display Technique” registers transmittance (T), the equation can be rewritten as:
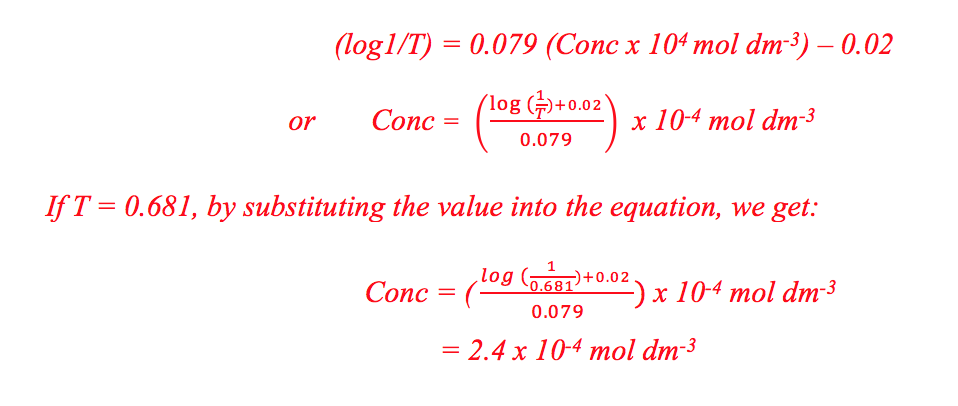
(e) Write an “Excel” spreadsheet computing program such that by substituting (T) values alone, concentrations can be displayed immediately without resorting to a formal equation.
Base on the equation![]() , create columns for concentration and transmittance (T) data input. Take an empty cell (B 25) under the transmittance (T) column, input the following function program:
, create columns for concentration and transmittance (T) data input. Take an empty cell (B 25) under the transmittance (T) column, input the following function program:
=PRODUCT(12.66,SUM(LOG10(PRODUCT(1/B25)),0.02))
Where 12.66 = 1/0.079, B 25 is under the transmittance (T) column. If B25 = 0.681, the cell next to it, i.e. A 25, will immediately display 2.37 x 10⁻⁴ mol dm-3 (Fig. 247)
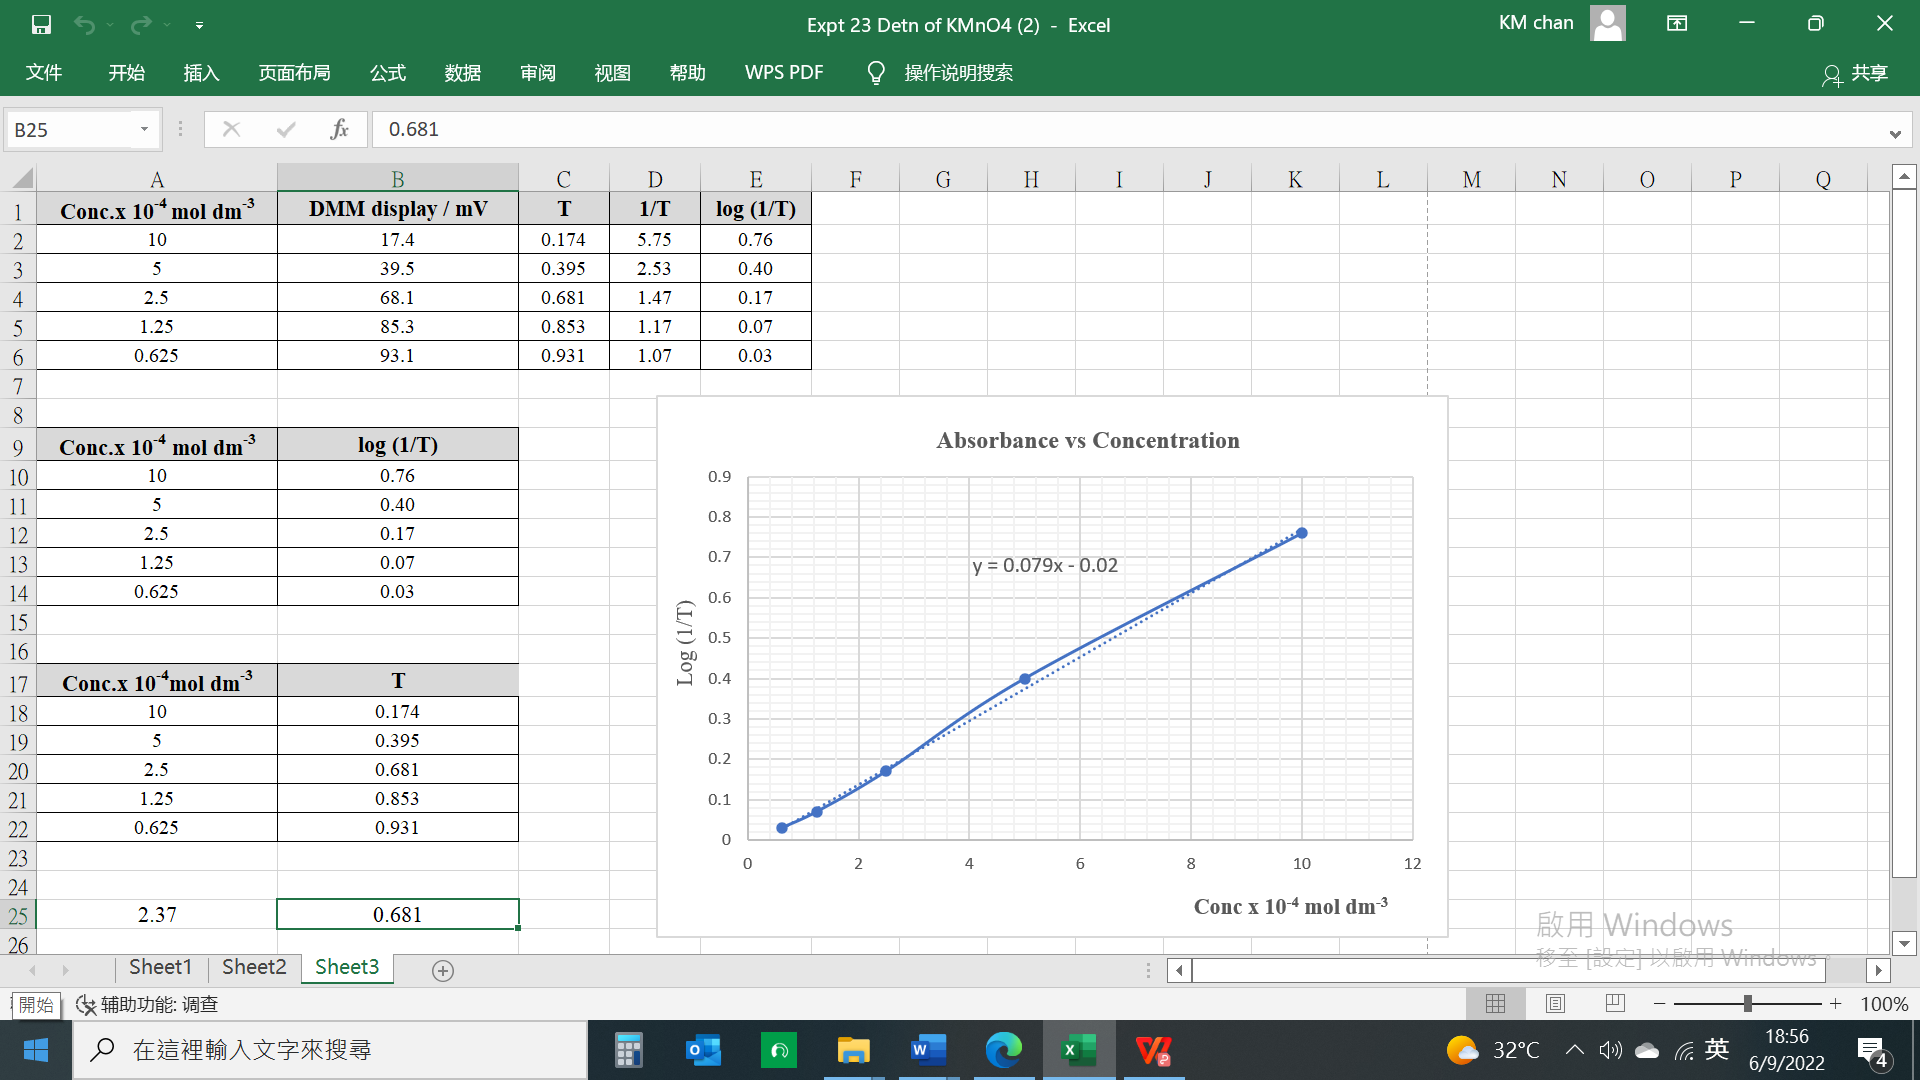
(Fig. 247) “Excel” spreadsheet transmittance (T) and concentration inter-conversion program and plotted graph
(vii) Conclusion
1. Base on the calibration graph (Fig. 247), concentration of KMnO4 solution X is deduced to be _______________________.
2. Referring to Fig. 244, the “Excel” spreadsheet function program platform, concentration of KMnO4 solution X is displayed as_____________________5
Expt (24): Determination of food dye present in a sample non-alcoholic drink
(i) Objective
By using a homemade colorimeter and the “DMM Display Technique”, determine the concentration of food coloring dye (Sunset Yellow, E110) in term of ppm in a sample of “Fan X” orange flavoured non-alcoholic soft drink.
(ii) Introduction
Food dyes are commonly added to packed or processed food to enhance their appearance for commercial purposes. For example, Monascin is brushed over roasted pork (叉燒) to make it look brilliant red. These food additives have to meet requirements of stringent international monitoring systems and standards. They are labelled with a starting letter E. Like (E 133) is Brilliant Blue, for cosmetics; (E110) is Sunset Yellow, for drinks etc.
These food dyes (irrespective of artificial or natural) are highly soluble in water. A pinch of them can render intense colour. They are suitable choices for standard solutions for colorimeter calibration. The experiment first uses Sunset Yellow for colorimeter calibration and then from the findings, determine the concentration of Sunset Yellow in a sample of commercial drink “Fan X” in terms of ppm (1 ppm = 1 part per million. For solutions, 1 ppm = 1 mg dm-3).
(iii) Safety
All chemicals and equipment used in this experiment cause no potential hazard. However, activities in a laboratory should be supervised by a science teacher and be cautious for every step in the Experimental procedures. Remember the golden rule of “wait 2 seconds before start”. |
|
(iv) Reagent and equipment
Reagent | Qty | Equipment | Qty |
200 ppm Sunset Yellow (E 110) solution | 25 cm3 | Homemade colorimeter with cables | 1 |
Decarbonized “Fan X” orange flavoured soft drink | 15 cm3 | DMM | 1 |
Deionized water | Suitable | Plastic cuvette | 1 |
| Pasteur pipette | 4 | |
100 cm3 ,250 cm3 beaker | 1@ | ||
500 cm3 volumetric flask | 1 | ||
Glass rod | 1 | ||
Micro stirring rod | 1 | ||
Tweezers | 1 pair | ||
Wash bottle with deionized water | 1 | ||
Spatula | 1 | ||
Electronic balance (±0.001g) | 1 | ||
(iv) Experimental procedures
| (A) | Preparation of a standard 200 ppm Sunset Yellow (E110) solution for colorimeter calibration | ||||||||||||||||||||||||||||||||||||||||||
| Weight out 0.100 g of Sunset Yellow, transfer it to a clean 100 cm3 beaker. Add deionized water and stir until completely dissolved. Transfer all of the solution into a 500 cm3 volumetric flask, add deionized water until the meniscus level of the neck just rest on top of the graduated mark. Stopper the volumetric flask. Invert and shake it thoroughly for 5 times. The concentration of the prepared SunSet Yellow standard solution is 200 ppm. Save about 100 cm3 of it as a stock for the calibration experiment. | |||||||||||||||||||||||||||||||||||||||||||
| (B) | Preparation of “Fan X” sample solution | ||||||||||||||||||||||||||||||||||||||||||
“Fan X” is a carbonated soft drink. It cannot be directly used for experiment right after opening the bottle. Use a Pasteur pipette to transfer about 10 cm3 to a 100 cm3 beaker, leave it to stay in open air for 20 minutes. Shake the beaker from time to time. | |||||||||||||||||||||||||||||||||||||||||||
| (C) | Set the light source of the colorimeter | ||||||||||||||||||||||||||||||||||||||||||
| 1. | Switch on the colorimeter, connect it to the DMM set at the DC 2000 mV Full scale range. Place 50 drops of the prepared “Fan X” sample solution into a clean cuvette, wipe the two clear opposite sides by a piece of tissue paper (Fig. 248). Lower it, with the clear sides facing the light source and the LDR, completely into bottom part of the cavity compartment (Fig. 249). Cover the compartment opening with a lid. Select the light source by rotating the knob to emit Red, Green and Blue LED monochromatic light rays in sequence. Determine which LED displays the most extent of light absorption. Convince that the Blue LED is the best choice. | ||||||||||||||||||||||||||||||||||||||||||
| 2. | The step which follows is to calibrate the colorimeter by Blue LED light: Place 50 drops of deionized water into a clean cuvette. Remember to follow the steps mentioned in step (1). Lower the cuvette completely into the bottom part of the cavity compartment and cover the opening with a lid. Adjust the knob until the DMM displays 100 mV (Fig. 250). Fix the position of the knob. calibration is completed and the setup is ready for experiment.
| ||||||||||||||||||||||||||||||||||||||||||
| (D) | Concentration determination of “Fan X” by colorimetry | ||||||||||||||||||||||||||||||||||||||||||
| (i) | Establish a calibration curve and deduce the concentration of SunSet Yellow in a sample of orange flavoured “Fan X” soft drink | ||||||||||||||||||||||||||||||||||||||||||
a. | Transfer 50 drops of 200 ppm SunSet Yellow standard solution to a clean cuvette (Fig. 248), remember to perform all the necessary following actions). Lower the cuvette completely into the bottom part of the cavity compartment and cover with the lid. Record the steady DMM ready. | ||||||||||||||||||||||||||||||||||||||||||
b. | Place 40 drops of 200 ppm SunSet Yellow standard solution into a clean cuvette follow by 10 drops of deionized water. Stir with a micro stirrer (remember to perform all the necessary following actions). Lower the cuvette completely into the bottom part of the cavity compartment and cover with the lid. Record the steady DMM ready. | ||||||||||||||||||||||||||||||||||||||||||
c. | Repeat step (b) with ratio of number of drops of SunSet Yellow to deionized water to be 30 : 20 | ||||||||||||||||||||||||||||||||||||||||||
d. | Repeat step (b) with ratio of number of drops of SunSet Yellow to deionized water to be 20 : 30 | ||||||||||||||||||||||||||||||||||||||||||
e. | Repeat step (b) with ratio of number of drops of SunSet Yellow to deionized water to be 10 : 40 | ||||||||||||||||||||||||||||||||||||||||||
f. | Complete the following table:
| ||||||||||||||||||||||||||||||||||||||||||
g. | Complete the following table:
| ||||||||||||||||||||||||||||||||||||||||||
h. | Activate the “Excel” spreadsheet software. Input data of step (f) and plot the XY scatter diagram of Conc. vs Transmittance calibration curve (Fig. 251). | ||||||||||||||||||||||||||||||||||||||||||
i. | With reference to the calibration curve and the colorimetric data of the sample of “FanX”, deduce the concentration of SunSet Yellow in “Fan X” in terms of ppm. | ||||||||||||||||||||||||||||||||||||||||||
| (ii) | Establish the absorbance linear plot of Beer’s law and deduce the concentration of SunSet Yellow in a sample of orange flavoured “Fan X” soft drink | ||||||||||||||||||||||||||||||||||||||||||
a. | Rewrite table (f) and input data of 1/T and log(1/T) as follows:
| ||||||||||||||||||||||||||||||||||||||||||
b. | Activate the “Excel” spreadsheet software and create columns of Conc. in ppm, transmittance (T), 1/T, and log(1/T). Draft a graph of Conc vs Absorbance, log(1/T). Obtain the corresponding regression line and its linear equation. Input “Excel” commands and write a simple program which by execution leads to displaying values of concentration in ppm by inputting values of transmittance (T). | ||||||||||||||||||||||||||||||||||||||||||
c. | Input the transmittance (T) of “Fan X” and record the concentration of SunSet Yellow in “Fan X” from the “Excel” platform. |
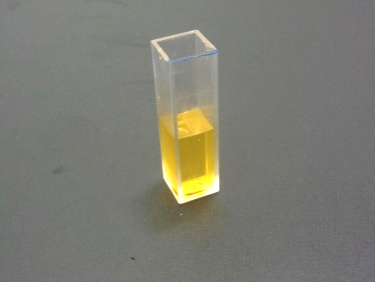
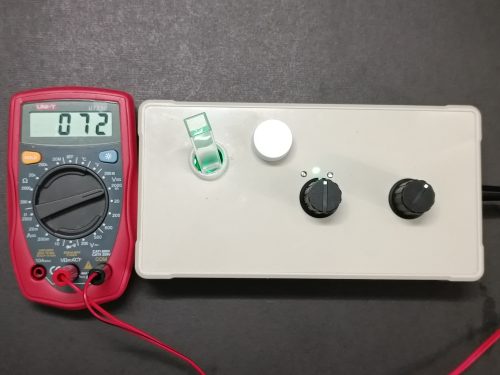
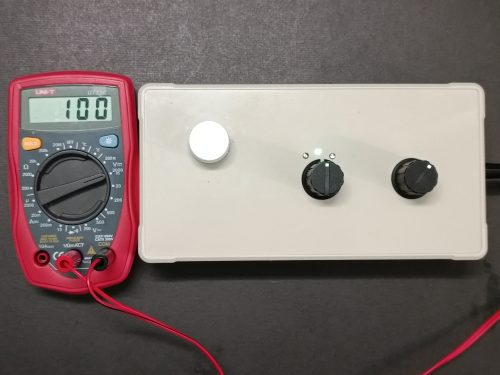
(v) Results and data treatment
(i) Establish the calibration curve and deduce the concentration of SunSet Yellow in a sample of orange flavoured “Fan X” soft drink
a. Experimental data:
Drops of standard SunSet Yellow solution | 50 | 40 | 30 | 20 | 10 |
Drops of deionized water | 0 | 10 | 20 | 30 | 40 |
Conc. of SunSet Yellow solution / ppm | 200 | 160 | 120 | 80 | 40 |
DMM display /2000 mV | 13 | 15 | 20 | 27 | 36 |
Transmittance (T) | 0.13 | 0.15 | 0.20 | 0.27 | 0.36 |
Drops of “Fan X” | 50 |
DMM display /2000 mV | 22 |
Transmittance (T) | 0.22 |
b. XY scattered diagram based on Conc. of SunSet Yellow in ppm vs transmittance (T) from the “Excel” spreadsheet:
![]()
(Fig. 251) Conc vs transmittance (T) calibration curve
c. Transmittance (T) of “Fan X” was determined as 0.22. From the above calibration plot, concentration of SunSet Yellow in “Fan X” is deduced to be 105 ppm.
(ii) Establish a calibration linear plot based on Beer’s law and deduce the concentration of SunSet Yellow in a sample of orange flavoured “Fan X” soft drink
a. Create a new page of “Excel” spread sheet. Input data columns of transmittance (T), 1/T, log(1/T) and Conc in ppm. Because too diluted solutions do not obey Beer’s law, therefore related data for 40 ppm concentration of SunSet Yellow will not be considered Establish the XY scattered diagram of Conc vs absorbance, log(1/T) and obtain the regression linear equation (Fig. 252).
b. Experimental data:
Drops of standard SunSet Yellow solution | 50 | 40 | 30 | 20 | 10 |
Drops of deionized water | 0 | 10 | 20 | 30 | 40 |
Conc. of SunSet Yellow solution / ppm | 200 | 160 | 120 | 80 | 40 |
DMM display /2000 mV | 13 | 15 | 20 | 27 | 36 |
Transmittance (T) | 0.13 | 0.15 | 0.20 | 0.27 | 0.36 |
1/T | 7.69 | 6.67 | 5.00 | 3.70 | 2.78 |
Log (1/T) | 0.89 | 0.82 | 0.70 | 0.57 | 0.44 |
c. From the plot of Fig. 252, derived linear equation is shown below:
ppm Conc = 363.03 log(1/T) – 130.34
In the D 10 cell of the Conc/ppm column, write a program using “Excel” command for a related Conc/ppm value in the A 10 cell.
=SUM(-130.24,363.03*(PRODUCT(LOG10(1/A10))))
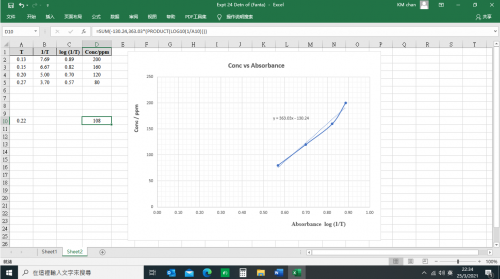
(Fig. 252) Conc. vs Absorbance XYscattered plot with trend line
d. Input a value of (T) of 0.22 in A 10 cell, the empty D 10 cell will immediately display a concentration value of 108 ppm.
e. Concentration of SunSet Yellow in “Fan X” orange flavoured soft drink was determined to be 108 ppm.
(vi) Conclusion
1. A formal calibration curve deduced the concentration of SunSet Yellow in a sample of orange flavoured “Fan X” to be 105 ppm.
2. By programming the “Excel” spreadsheet, the concentration of SunSet Yellow in a sample of orange flavoured “Fan X” was deduced to be 108 ppm.
Expt (25): Kinetic order of the acidic oxidation of iodide ion by hydrogen peroxide
(i) Objective
To test the hypothesis that the oxidation of iodide ion by acidified hydrogen peroxide solution is a first order reaction
(ii) Introductory information
(a) Theoretical considerations
1. Equation of the oxidation of iodide ion by acidified hydrogen peroxide solution:
H2O2(aq) + 3I-(aq) + 2H+(aq) → I3-(aq) + 2H2O(l)
Commonly expressed as:
H2O2(aq) + 2I-(aq) + 2H+(aq) → I2(aq) + 2H2O(l)
Reactant iodide ion is selected for the kinetic study, product of reaction is iodine which forms the deep brown I3-(aq) complex ion which is very suitable for colorimetric concentration determination. Iodide ion is completely reacted to form I3-(aq). Excess of H2O2(aq) is avoided because the I3-(aq) will be oxidized back to I2 which appears as greyish black precipitate and will ruin the whole colorimetric experiment.
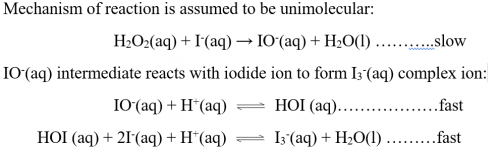
Overall reaction rate is controlled by the rate determining step, or the slow elementary reaction. Stoichiometric coefficient is based on the elementary reaction which first order w.r.t. H2O2(aq) and I-(aq) respectively.
Stioichiometric coefficient of iodide ion for the experimental equation is 2 and not 1. Hence, there is a need to find out experimentally the kinetic order w.r.t. iodide ion.
Since we assume the redox reaction is a first order reaction, we adopt the method of half-life inspection. The decay curve of iodide ion concentration obeys the exponential form equation of a first order reaction
[A] = [A]o e-kt
When iodide ion is consumed, or decayed, its concentration decreases. At a point when its concentration is reduced by half: [A] = [A]o. Time taken to reach the half-life, [A]/[A]o = e-kt1/2,
– ln 2 = – k t1/2
t1/2 = ln2/k = constant.
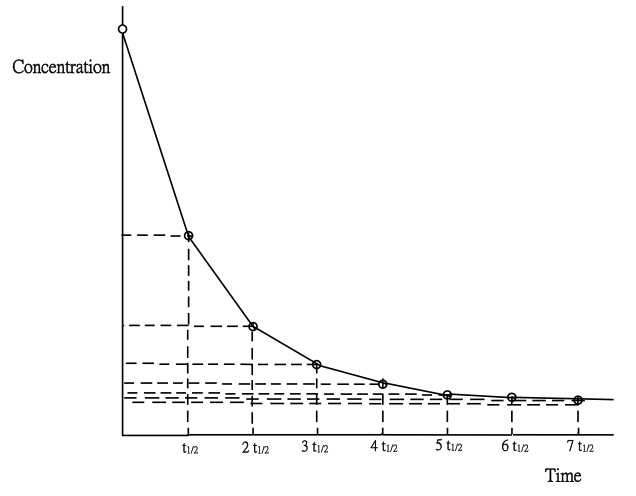
(Fig. 253) A first order decay curve showing successive half-lives
Inspection of Fig. 253 shows, for a first order reaction, time for consecutive difference of half-lives is a constant.
(b) Experimental considerations
Colorimeter used for the experiment is the homemade instrument mentioned in Topic 5.3. It features the use of the “DMM Display Technique” involving a low cost DMM as the instrument’s terminal display. The colorimeter measures only transmittance (T) of colour solutions. Calibration of the instrument is done by adjusting to a 100 mV display when a blank sample is used for a selected monochromatic LED light source. This situation is interpreted as T = 1.00 or 100% transmittance. When I3-(aq) is formed from I2(aq), the colourless solution starts to become light brown which gradually turns to deep brown. DMM display starts to drop from 100 mV. Rate of drop of numerical display is the fastest at the beginning and slows down as time elapses. Measurement of concentration of reactants is not required, as long as the colour intensity of the solution can cause decent absorption of monochromatic light, not too intense nor too light. The experimental aim is to plot a decay curve showing at least 4 or more half-lives.
(iii) Safety
Wear safety spectacles and avoid skin contact with chemicals. Use minimum amount of reagents. Dispose of chemical waste and excess materials properly. |
|
(iv) Reagent and equipment
Reagent | Qty | Equipment | Qty |
* 0.6 M KI | 10 cm3 | Homemade colorimeter | 1 |
* 1 M H2SO4 | 10 cm3 | DMM | 1 |
3% H2O2 | 10 cm3 | Plastic cuvette | 3 |
Deionized water | Suitable amount | Pasteur pipette | 4 |
100 cm3 and 250 cm3 beaker | 1@ | ||
Micro-stirrer | 1 | ||
Wash bottle with deionized water | 1 | ||
Stopwatch | 1 | ||
Tweezers | 1 pair | ||
Plastic protective gloves | 1 pair | ||
*
(v) Experimental procedures
(A) Set instrument for full scale blank sample calibration (i.e. 100 mV) with a selected monochromatic LED light source
1. Activate the colorimeter and connect it to the DMM set at the DC 2000 mV full scale range.
2. Selected the green monochromatic LED light source.
3. Fill a clean plastic cuvette 3/4 full with deionized water. Wipe the opposite clear sides with a piece of issue paper.
4. Lower the cuvette and its content completely to the bottom part of the cavity compartment and cover the opening with the lid.
5. Rotate the knob until a steady display of 100 mV is achieved. Fix the position of the knob. Calibration has been completed and the instrument is ready for measurement.
(B) Testing for a first order reaction kinetics
1. | Using clean Pasteur pipettes, add separately 4 drops of 0.6M KI(aq) and 5 drops of 1M H2SO4(aq) into a clean cuvette. Stir well with a micro-stirrer. |
2. | Put on the plastic gloves. Carefully add 1 drop of 3% H2O2 (aq). Stopper the mouth of the cuvette with one finger (wearing protective gloves), quickly invert the cuvette 3 times for complete mixing. Wipe the two opposite clear sides of the cuvette with a piece of tissue. Lower the cuvette completely into the bottom part of the cavity compartment and cover it with the lid. Start the stopwatch |
3. | Record DMM readings and complete Table (2). |
Mixing scheme (Table 1):
Reactant | No. of drops | Remarks |
0.6 M KI | 4 | Not necessary 4 drops. The purpose is to create a half-life time not too short nor too long. A suitable t1/2 is 200s. |
1 M H2SO4 | 5 | Amount used should be in excess |
3% H2O2 | 1 | Number of drops should not be large, otherwise excess H2O2 will precipitate solid iodine and affects light transmittance. Amount used should all be consumed |
Deionized water | 35 | Adjust number of drops added to achieve a suitable reaction rate. |
(vi) Results: (Table 2)
time / s | DMM display/ 2000 mV | time / s | DMM display/ 2000 mV |
0 | 100 | 660 | 34 |
15 | 97 | 720 | 32.5 |
30 | 94 | 780 | 31.5 |
45 | 91 | 840 | 30.5 |
60 | 88 | 900 | 29.5 |
75 | 85.5 | 960 | 29 |
90 | 83 | 1020 | 28 |
105 | 81 | 1080 | 27.5 |
120 | 78 | 1140 | 27 |
150 | 73.5 | 1200 | 26 |
180 | 69 | 1260 | 26 |
210 | 65 | 1320 | 25.5 |
240 | 62 | 1380 | 25 |
270 | 58 | 1440 | 25 |
300 | 55 | 1500 | 24.5 |
360 | 49.5 | 1560 | 24 |
420 | 45 | 1620 | 24 |
480 | 41.5 | 1680 | 24 |
540 | 38.5 | 1740 | 24 |
600 | 36 | 1800 | 24 |
(vii) Data treatment
Activate the “Excel” spreadsheet software. Input data of time elapsed and % transmittance. Plot the XY scattered diagram. Estimate from the decay curve, the time for the first, second, third and forth half-lives.
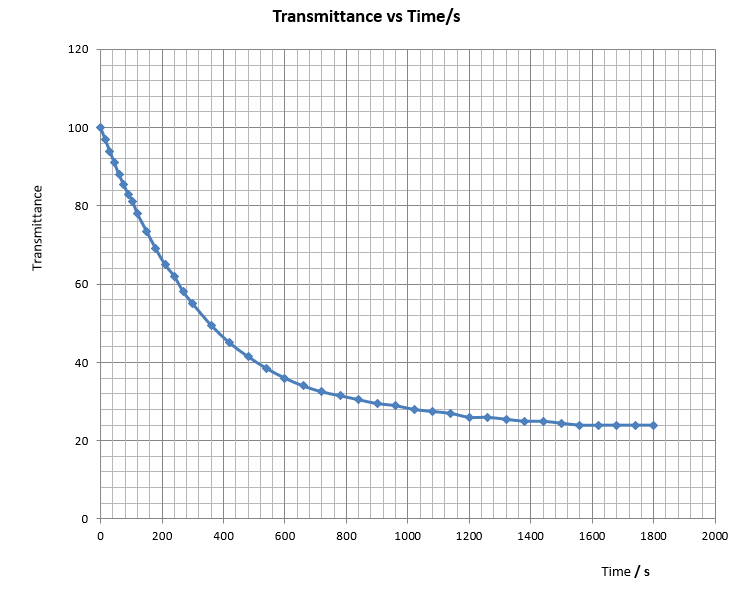
% transmittance drop for the experiment = (100 – 24) = 76
First half-life occurs when 100 drops to [(100 – 76)/2)] = 62.
Time taken = 230 s
Second half-life occurs when 62 drops to [62 – (62 – 24)/2] = 43.
Time taken = 460 s
Third half-life occurs when 43 drops to [43 – (43 – 24)/2] = 33.5.
Time taken = 690 s
Fourth half-life occurs when 33.5 drops to [33.5 – (33.5 – 24)/2] = 28.8.
Time taken = 970 s
Half-life | Tme / s | Consecutive difference of half-lives / s |
First | 230 | 230 |
Second | 460 | (460 – 230)= 230 |
Third | 690 | (690 – 460)= 230 |
Forth | 970 | (970 – 690)= 280 |
Consecutive difference of the first, second and third half-lives are the same. Starting from the fourth half-life, moving to the fifth and the sixth half-lives, collected data are heavily loaded with graphical errors and they are not acceptable.
(viii) Conclusion
The hypothesis that the oxidation of iodide ion by acidified hydrogen peroxide solution is a first order reaction was found experimentally valid by using the method of half-life inspection.
(ix) Discussion
1. What variable was selected for experimental investigation? Decrease in concentration of iodide ion or the formation of iodine?
Aqueous iodide ion is colourless which alone cannot be used for colorimetry. Formation of iodine during reaction immediately reacts further with iodide ion to form brown complex ion I3-(aq) which is a valid variable for colorimetry. Decrease of iodide ion is stoichiometrically the same as formation of iodine.
2. Briely explain why there is no need to consider measuring the concentration of iodine formed.
Regardless of initial concentration of reactants, a decay curve will always form. Therefore, it is unnecessary to know the initial concentration nor the concentration of the product formed.
3. Are measured half-lives constant?
Experimental results show the first three half-lives are the same. Therefore, half-life of the reaction is a constant.
4. Briefly explain whether or not the reaction is a first order reaction w.r.t. iodide ion.
As the half-lives of the consumption of iodide ion are constant, the kinetic order w.r.t. iodide ion is one.
5. Briefly describe another experimental method which can serve the same purpose of this experiment.
Apart from using colorimeter, the following method can also be employed to find out the kinetic order w.r.t. I-(aq), H2O2(aq) and H+(aq):
By limiting a fixed small amount of iodine formed during reaction and find out the kinetic dependence of a selected reactant (as variable) on its concentration. The method was well known as an “iodine clock reaction”. The key factor is to use a fixed small amount of thiosulphate (which consumes iodine formed) and starch indicator (which indicates appearance of iodine). When the solution mixture suddenly becomes deep blue, that indicates all thiosulphate has been consumed and the iodine formed from the main reaction causes the indicator to change colour. If the concentration of the selected variable is doubled and the time taken for the deep blue colour to appear is reduced by half, then the kinetic order w.r.t. the ion is by definition to be one (revise Expt. 11).
6. According to the equation: H2O2(aq) + 2I-(aq) + 2H+(aq) → I2(aq) + 2H2O(l), stoichiometric coefficient of iodide ion is 2. Why is it that the kinetic order of the reaction w.r.t. iodide ion is 1 and not 2?
Quantitative calculations of chemical equations are based on stoichiometric coefficient of reactants. The purpose is to calculate how much product can be produced from reactants. From the above equation, 1 mole H2O2(aq), 2 moles I-(aq) and 2 moles H+(aq) react together to undergo complete reaction. Stoichiometric coefficients are solely used for chemical mass calculations, they are not related to reaction rates.
Kinetic orders of reactions are related to reaction rates of the reactions. They cannot be deduced from the equations themselves. They are obtainable only by performing experiments.
Experimental findings of the redox reaction showed by doubling the concentration of I-(aq), the reaction rate increases two times. Hence, the kinetic order w.r.t. I-(aq) is 1 and not 2. Hence rate of reaction is ∝ [I-(aq)]
Stoichiometric coefficient and kinetic order are not related.
7. Apart from using a decay curve, describe another method that can determine the kinetic order w.r.t. I-(aq) is 1.
For a first order reaction, the rate law can be expressed as:
Differential form – d[A]/dt = k[A]
Integral form ln [A] = ln[A]o – kt
Exponential form [A] = [A]o e-kt or ln([A]o/[A]) = kt
For a first order reaction, a plot of ln([A]o/[A]) vs t should obtain a straight line through the origin with slope k. Using the “DMM Display Technique”, [A]o is 100,[A] are DMM display figures. Because of the fact that the first 3 half-lives are constant but not the ones that follows, the decay data after 180s will be discarded for a better picture of the initial situations. For all reactions, initial rates are almost impurity-free.
[A] | [A]o | [A]o/[A] | ln([A]o/[A]) | Time / s |
100 | 100 | 1.00 | 0.00 | 0 |
97 | 100 | 1.03 | 0.03 | 15 |
94 | 100 | 1.06 | 0.06 | 30 |
91 | 100 | 1.10 | 0.10 | 45 |
88 | 100 | 1.14 | 0.13 | 60 |
85.5 | 100 | 1.17 | 0.16 | 75 |
83 | 100 | 1.20 | 0.18 | 90 |
81 | 100 | 1.23 | 0.21 | 105 |
78 | 100 | 1.28 | 0.25 | 120 |
73.5 | 100 | 1.36 | 0.31 | 150 |
69 | 100 | 1.45 | 0.37 | 180 |
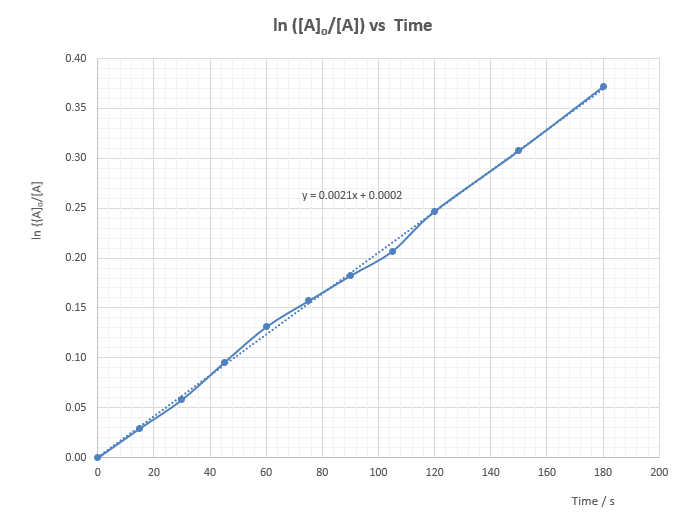
ln([A]o/[A]) vs t is a st. line graph through the origin. Therefore, the kinetic order w.r.t. I-(aq) is 1
Expt (26): Kinetic order of decolorization of phenolphthalein in a strong alkaline solution
(i) Objective
1. For the reaction between phenolphthalein and excess of sodium hydroxide solution, determine the kinetic order w.r.t. phenolphthalein.
2. To demonstrate the fading of phenolphthalein in sodium hydroxide solution is a second order reaction.
(ii) Introduction
Phenolphthalein is one of the most common acid/base indicators used to determine end points in acid/base titrations. If excess of alkali is present after the end point is reached, the deep pink phenolphthalein color fades if the solution is allowed to stand for a while.
Phenolphthalein is a weak acid which ionizes as:
H2P(aq) ![]() 2H+(aq) + Ph2-(aq)
2H+(aq) + Ph2-(aq)
Colorless pink
Addition of an alkali, OH-(aq), shifts the ionic equilibrium to the right and imparts a pink colour in aqueous solutions and will shift to the right to become colourless if an acid is added. When pH of the solution reaches 8, the colourless solution starts to change to pink and will become intense pink on further increase of pH. At pH above 10 the pink color slowly fades as Ph2- reacts further with NaOH, (OH-), to give the colourless complex ion P(OH)3- ion according to the equation:
Ph2-(aq) + OH-(aq) → P(OH)3-(aq)
pink colorless
The rate law for this reaction can be expressed as: Rate = k [Ph2-]n[OH-]m, where n is the kinetic order w.r.t. phenolphthalein and m is the kinetic order w.r.t.NaOH.
(i) To address objective (1), the reactant OH-(aq) ion is purposely used in large excess so that its concentration remains almost unchanged before and after the reaction, or the concentration is a constant and m = 0. The kinetic order determined under such situation is the kinetic order w.r.t. phenolphthalein and is called a “pseudo-order”.
Rate of decrease of [Ph2-] = rate = k [Ph2-]n[OH-]m
In large excess of NaOH, rate = kn[Ph2-]n, where kn = k [OH-]m
For a first order reaction, n = 1, rate = kn[Ph2-]or ln [Ph2-] = – knt + ln [Ph2-]o
Unlike Expt (25) in which transmittance is decreasing, transmittance for this experiment is increasing or absorbance, ie. A is decreasing. Since [Ph2-] is directly proportional to the absorbance A of the solution, a graph of (A) vs t represents the decay of [Ph2-]. By examining the decay curve of (A) vs t, if consecutive t1/2 is a constant, then the order w.r.t. Ph2- is 1. Alternatively, a graph of ln (A) vs t should be a straight line with a negative slope kn.
(ii) Method of (i) cannot be applied to the other reactant NaOH for addressing objective (2) because we should not employ a large excess of indicator phenolphthalein. The method adopted is to vary the concentration of NaOH. As the reaction involves the approach of two negatively charged ions (Ph2-) and OH-, and their mutual repulsion creates a situation unfavourable for reaction. Direct water dilution of NaOH for kinetic experiment enhances the drawback. Therefore, it is essential for the total ionic concentration (total ionic strength) during dilution remains the same. In this respect, inert (spectator) ions are purposely added to make the ionic strength (internet search) constant. Instead of adding water for dilution, NaCl solution will be added.
Reaction: Ph2- + OH- → P(OH)3-
Rate law: rate = k [Ph2-]n[OH-]m
The rate law becomes: Rate = kn [Ph2-]n, where kn = k [OH-]m
By considering various n times diluted solution mixture of (NaOH + NaCl), a plot of ln (1/T) vs t gives kn and a plot of kn versus [OH-] should comply with the criterion for a pseudo first order w.r.t. OH-. A straight line shows kn is directly proportional to [OH-] or the order w.r.t OH- is one. An alternative order determination, eg. m, is the find the slope of the plot of ln kn against ln [OH-]. Base on the equation ln kn = ln k + m ln [OH-], the slope m will be the order w.r.t. OH-.
(iii) Safety
Wear safety spectacles and avoid skin contact with chemicals. Use minimum amount of reagents. Dispose of chemical waste and excess materials properly. |
|
(iii) Reagent and equipment
Reagent | Qty | Equipment | Qty |
* 0.4 M NaOH | 25 cm3 | Homemade colorimeter with cables | 1 |
0.3 M NaCl | 15 cm3 | DMM | 1 |
Phenolphthalein | 0.1% solution | Plastic cuvette | 1 |
Deionized water | Suitable amount | Pasteur pipette | 3 |
10 cm3 graduated pipette | 2 | ||
100 cm3 beaker | 2 | ||
Stopwatch | 1 | ||
glass rod stirrer | 1 | ||
Wash bottle with deionized water | 1 | ||
Tweezers | 1 | ||
Plastic protective gloves | 1 pair | ||
*
(iv) Experimental procedures
(a) Determination of kinetic “pseudo-order” w.r.t. phenolphthalein
1. Connect the colorimeter to the DMM set at the DC 2000 mV range. Switch on the colorimeter.
2. Using a clean Pasteur pipette, transfer 50 drops of 0.4M NaOH into an empty and clean cuvette. Wipe the two opposite clear sides with a piece of tissue. Lower the cuvette completely into the bottom part of the cavity compartment and cover it with the lid. Select the green LED light source and adjust the knob to a display of 100 mV. The colorimeter has been calibrated for the green LED light source. Fix the position of the knob.
3. Put on the protective gloves and with the help of a pair of tweezers, take out the cuvette with the content, carefully add 2 drops of phenolphthalein indicator. Stopper the mouth of the cuvette with one finger (wearing protective gloves), quickly invert the cuvette 3 times for complete mixing. Wipe the two opposite clear sides of the cuvette with a piece of tissue. Lower the cuvette completely into the bottom part of the cavity compartment and cover it with the lid. Start the stopwatch.
4. Record the DMM readings at 15 second intervals, complete Table (2) for a duration of 8 mins or when the readings become flat.
(b) Determination of the kinetic order of fading of phenolphthalein w.r.t. OH-(aq)
1. Prepare stock solutions (i) to (v) by mixing thoroughly solutions of 0.4 M NaOH and 0.3 M NaCl according to the scheme listed in Table (1).
Complete Table (1)
Solution | 0.4 M NaOH / cm3 | 0.3 M NaCl / cm3 | Molarity (OH)-(aq) / M |
(i) | 10 | 0 | 0.40 |
(ii) | 9 | 1 | 0.36 |
(iii) | 8 | 2 | 0.32 |
(iv) | 7 | 3 | 0.28 |
(v) | 6 | 4 | 0.24 |
2. Repeat procedure (A) step 1 to 4 with solutions (ii), (iii), (iv) and (v). Complete Tables (3), (4), (5) and (6) respectively.
(v) Results and data treatment
(a) Kinetic order determination of phenolphthalein
Temperature = 27 oC
This part concerns solution (i). Complete Table (2):
Table (2):
1 / s | DMM reading /mV | T | 1/T | ln (1/T) or (A) | ln(A) |
0 | 30.5 | 0.305 | 3.28 | 1.19 | 0.17 |
5 | 32.9 | 0.329 | 3.04 | 1.11 | 0.11 |
10 | 34.9 | 0.349 | 2.87 | 1.05 | 0.05 |
15 | 37.7 | 0.377 | 2.65 | 0.98 | -0.02 |
20 | 40.7 | 0.407 | 2.46 | 0.90 | -0.11 |
25 | 43.7 | 0.437 | 2.29 | 0.83 | -0.19 |
30 | 47.1 | 0.471 | 2.12 | 0.75 | -0.28 |
35 | 50.5 | 0.505 | 1.98 | 0.68 | -0.38 |
40 | 53.7 | 0.537 | 1.86 | 0.62 | -0.48 |
45 | 56.5 | 0.565 | 1.77 | 0.57 | -0.56 |
50 | 59.5 | 0.595 | 1.68 | 0.52 | -0.66 |
55 | 62.2 | 0.622 | 1.61 | 0.47 | -0.74 |
60 | 64.6 | 0.646 | 1.55 | 0.44 | -0.83 |
70 | 69.2 | 0.692 | 1.45 | 0.37 | -1.00 |
80 | 73.1 | 0.731 | 1.37 | 0.31 | -1.16 |
90 | 76.4 | 0.764 | 1.31 | 0.27 | -1.31 |
100 | 79.5 | 0.795 | 1.26 | 0.23 | -1.47 |
110 | 82.1 | 0.821 | 1.22 | 0.20 | -1.62 |
120 | 84.3 | 0.843 | 1.19 | 0.17 | -1.77 |
135 | 87.1 | 0.871 | 1.15 | 0.14 | -1.98 |
150 | 89.4 | 0.894 | 1.12 | 0.11 | -2.19 |
170 | 91.9 | 0.919 | 1.09 | 0.08 | -2.47 |
190 | 93.0 | 0.930 | 1.08 | 0.07 | -2.62 |
220 | 95.9 | 0.959 | 1.04 | 0.04 | -3.17 |
250 | 97.4 | 0.974 | 1.03 | 0.03 | -3.64 |
300 | 98.8 | 0.988 | 1.01 | 0.01 | -4.42 |
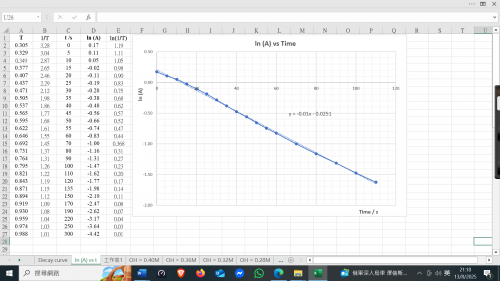
1. Plot (A) vs t and determine the first 3 consecutive half-lives.
First half-life occurs when (A) drops from 1.20 to 0.60, time taken = 43 s
Second half-life occurs when (A) drops from 0.60 to 0.30, time taken = 85 s
Third half-life occurs when when (A) drops from 0.30 to 0.15, time taken = 130 s
| Half-life | Tme / s | Consecutive difference of half-lives / s |
First | 43 | 43 |
Second | 85 | (85- 43)=42 |
Third | 130 | (130 – 85)= 45 |
The first two half-lives are the same, deviation starts from the third half-life when the colour intensity becomes too light. On the whole, kinetic order of the reaction w.r.t. phenolphthalein is 1.
2. Plot ln (A) vs t for t = 0s to t = 300s. Determine the slope of the st. line, i.e. k1.

A straight trendline indicated a first order reaction. Slope of the trendline, k1= -0.01
Fading of phenophthalein in excess of OH-(aq) ion
b. Kinetic order determination of hydroxide ion
Temperature = 22oC
This part concerns solutions (ii), (iii), (iv) and (v).
Table (3), [OH–] = 0.36 M | Table (4), [OH–] = 0.32 M | ||||||||||||||||||||||||||||||||||||||||||||||||||||||||||||
|
|
Table (5), [OH–] = 0.28 M | Table (6), [OH–] = 0.24 M | |||||||||||||||||||||||||||||||||||||||||||||||||||||||||||||
|
| |||||||||||||||||||||||||||||||||||||||||||||||||||||||||||||
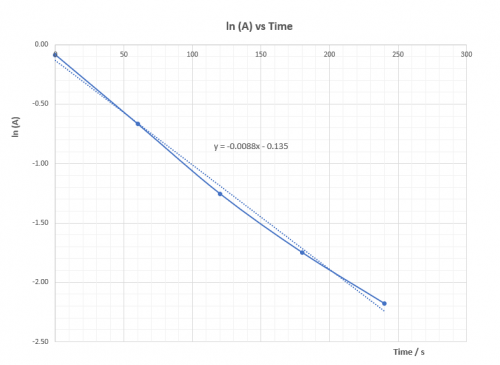 | 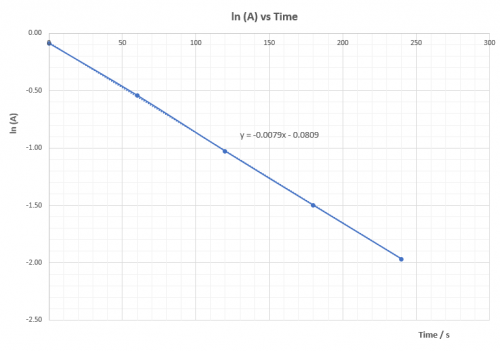 | |||||||||||||||||||||||||||||||||||||||||||||||||||||||||||||
[OH–] = 0.36 M, k2 = -0.0088 | [OH–] = 0.32 M, k3 = -0.0079 | |||||||||||||||||||||||||||||||||||||||||||||||||||||||||||||
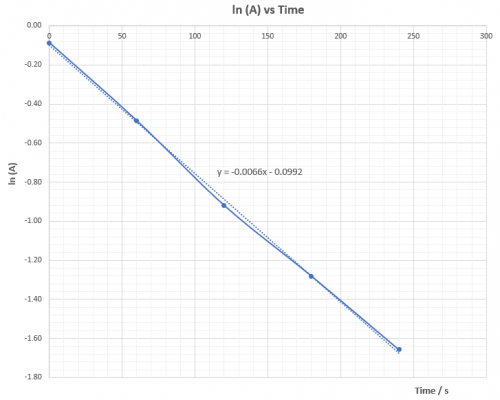 | 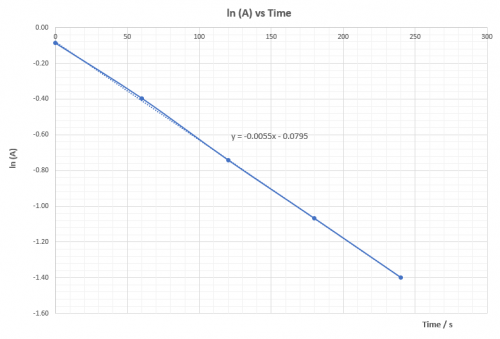 | |||||||||||||||||||||||||||||||||||||||||||||||||||||||||||||
[OH–] = 0.286 M, k4 = -0.0066 | [OH–] = 0.24 M, k5 = -0.0055 | |||||||||||||||||||||||||||||||||||||||||||||||||||||||||||||
1. Plot a graph of [OH–] vs kn:
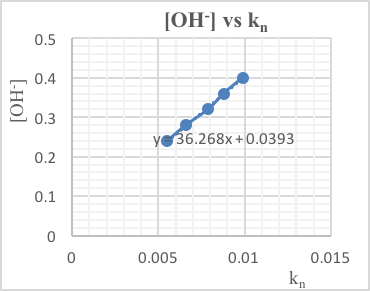
The above plot shows OH– is nearly directly proportional to kn. According to the equation kn = k [OH–]m, m ~ 1 or the reaction is first order w.r.t. OH–.
2. Plot a graph of ln kn vs ln [OH–]:
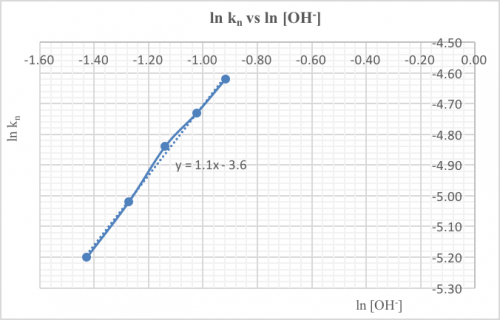
Slope of the above straight line graph is ~1. According to the equation kn = k[OH–]m, ln kn = ln k + m ln [OH–], m ~ 1 or the reaction is first order w.r.t. OH–.
(vi) Conclusion
Phenolphthalein indicator is colourless in acidic solution. When the pH value of the aqueous solution reaches 8.2, usually by adding OH–(aq), phenolphthalein changes to pink. Intensity of the colour deepens, appearing as bright magenta at pH 10 or above. further increase of pH results in the fading of the existing colour. Above pH 13, it becomes completely colourless.
From the experiment, it was found that using a large excess of OH–(aq), colour fading of phenolphthalein is a first order reaction, or called as a pseudo first order reaction. The kinetic order w.r.t. OH–(aq) was also found to be 1. Overall order of the fading reaction of phenolphthalein in sodium hydroxide solution is therefore 2.